Immigrants from Burma/Myanmar vs Immigrants from Spain High School Diploma
COMPARE
Immigrants from Burma/Myanmar
Immigrants from Spain
High School Diploma
High School Diploma Comparison
Immigrants from Burma/Myanmar
Immigrants from Spain
86.7%
HIGH SCHOOL DIPLOMA
0.1/ 100
METRIC RATING
276th/ 347
METRIC RANK
89.5%
HIGH SCHOOL DIPLOMA
76.2/ 100
METRIC RATING
146th/ 347
METRIC RANK
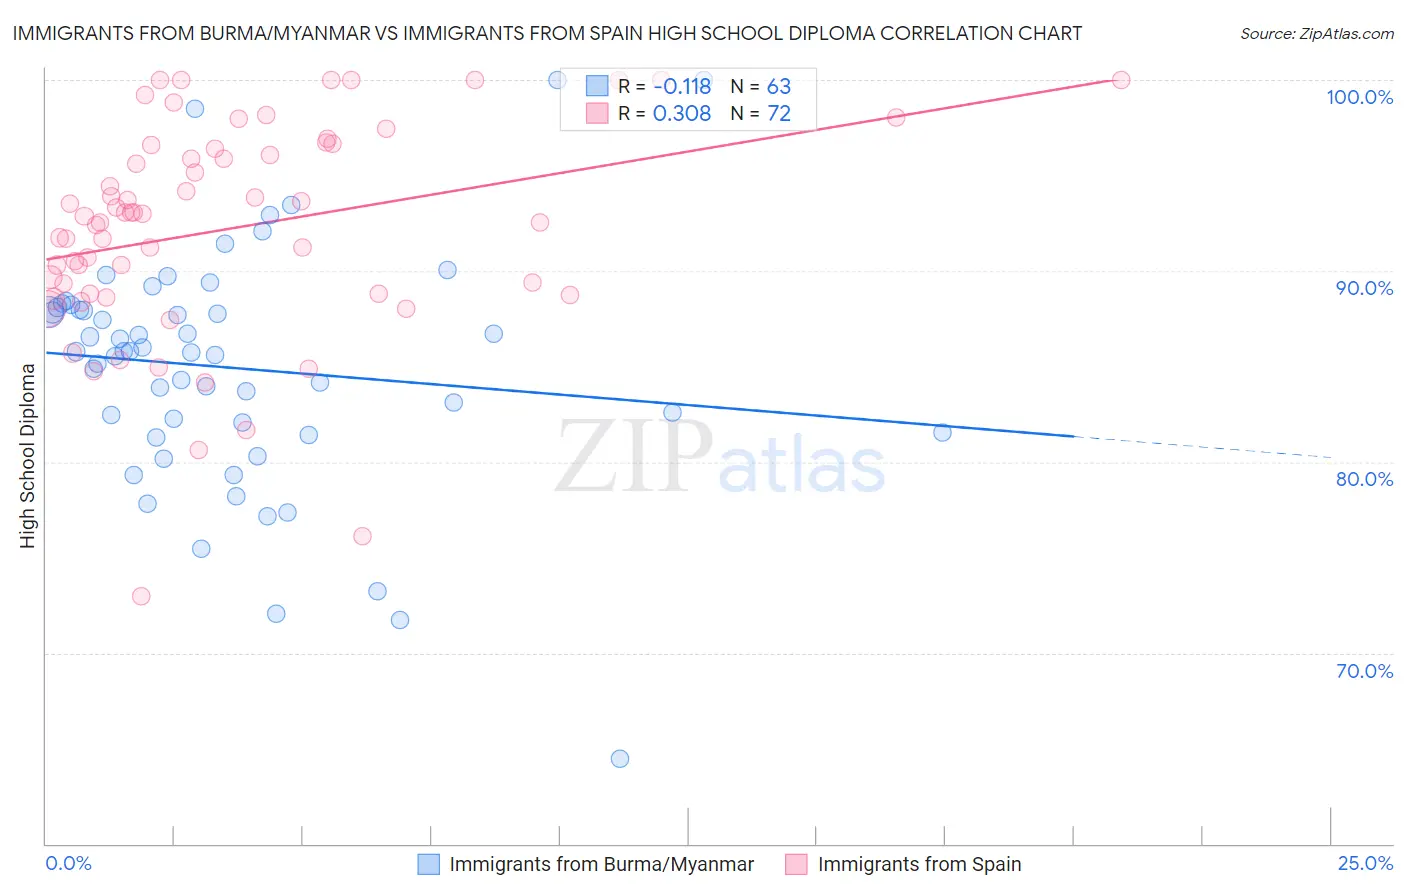
Immigrants from Burma/Myanmar vs Immigrants from Spain High School Diploma Correlation Chart
The statistical analysis conducted on geographies consisting of 172,345,696 people shows a poor negative correlation between the proportion of Immigrants from Burma/Myanmar and percentage of population with at least high school diploma education in the United States with a correlation coefficient (R) of -0.118 and weighted average of 86.7%. Similarly, the statistical analysis conducted on geographies consisting of 239,682,725 people shows a mild positive correlation between the proportion of Immigrants from Spain and percentage of population with at least high school diploma education in the United States with a correlation coefficient (R) of 0.308 and weighted average of 89.5%, a difference of 3.3%.
High School Diploma Correlation Summary
| Measurement | Immigrants from Burma/Myanmar | Immigrants from Spain |
| Minimum | 64.5% | 72.9% |
| Maximum | 100.0% | 100.0% |
| Range | 35.5% | 27.1% |
| Mean | 84.9% | 92.2% |
| Median | 85.8% | 92.9% |
| Interquartile 25% (IQ1) | 81.5% | 88.8% |
| Interquartile 75% (IQ3) | 88.1% | 96.5% |
| Interquartile Range (IQR) | 6.6% | 7.7% |
| Standard Deviation (Sample) | 6.3% | 5.6% |
| Standard Deviation (Population) | 6.3% | 5.6% |
Similar Demographics by High School Diploma
Demographics Similar to Immigrants from Burma/Myanmar by High School Diploma
In terms of high school diploma, the demographic groups most similar to Immigrants from Burma/Myanmar are Barbadian (86.7%, a difference of 0.010%), Immigrants from Trinidad and Tobago (86.8%, a difference of 0.070%), Hopi (86.6%, a difference of 0.11%), Immigrants from Laos (86.6%, a difference of 0.16%), and Pueblo (86.5%, a difference of 0.18%).
| Demographics | Rating | Rank | High School Diploma |
| Sri Lankans | 0.2 /100 | #269 | Tragic 87.0% |
| Malaysians | 0.2 /100 | #270 | Tragic 87.0% |
| West Indians | 0.1 /100 | #271 | Tragic 86.9% |
| Trinidadians and Tobagonians | 0.1 /100 | #272 | Tragic 86.9% |
| Immigrants | Jamaica | 0.1 /100 | #273 | Tragic 86.9% |
| Bangladeshis | 0.1 /100 | #274 | Tragic 86.9% |
| Immigrants | Trinidad and Tobago | 0.1 /100 | #275 | Tragic 86.8% |
| Immigrants | Burma/Myanmar | 0.1 /100 | #276 | Tragic 86.7% |
| Barbadians | 0.1 /100 | #277 | Tragic 86.7% |
| Hopi | 0.1 /100 | #278 | Tragic 86.6% |
| Immigrants | Laos | 0.0 /100 | #279 | Tragic 86.6% |
| Pueblo | 0.0 /100 | #280 | Tragic 86.5% |
| Indonesians | 0.0 /100 | #281 | Tragic 86.5% |
| Dutch West Indians | 0.0 /100 | #282 | Tragic 86.5% |
| Immigrants | Barbados | 0.0 /100 | #283 | Tragic 86.4% |
Demographics Similar to Immigrants from Spain by High School Diploma
In terms of high school diploma, the demographic groups most similar to Immigrants from Spain are Immigrants from Brazil (89.5%, a difference of 0.010%), Immigrants from Kenya (89.6%, a difference of 0.040%), Pakistani (89.6%, a difference of 0.050%), Iraqi (89.5%, a difference of 0.050%), and Chilean (89.6%, a difference of 0.060%).
| Demographics | Rating | Rank | High School Diploma |
| Kenyans | 81.4 /100 | #139 | Excellent 89.6% |
| Immigrants | Egypt | 81.2 /100 | #140 | Excellent 89.6% |
| Chileans | 79.0 /100 | #141 | Good 89.6% |
| Indians (Asian) | 78.8 /100 | #142 | Good 89.6% |
| Pakistanis | 78.3 /100 | #143 | Good 89.6% |
| Immigrants | Kenya | 78.0 /100 | #144 | Good 89.6% |
| Immigrants | Brazil | 76.6 /100 | #145 | Good 89.5% |
| Immigrants | Spain | 76.2 /100 | #146 | Good 89.5% |
| Iraqis | 73.9 /100 | #147 | Good 89.5% |
| Immigrants | Lebanon | 73.4 /100 | #148 | Good 89.5% |
| Immigrants | Poland | 72.9 /100 | #149 | Good 89.5% |
| Argentineans | 72.3 /100 | #150 | Good 89.5% |
| Paraguayans | 71.4 /100 | #151 | Good 89.5% |
| Asians | 70.7 /100 | #152 | Good 89.4% |
| Immigrants | Iraq | 68.7 /100 | #153 | Good 89.4% |