Immigrants from Bosnia and Herzegovina vs Ottawa College, 1 year or more
COMPARE
Immigrants from Bosnia and Herzegovina
Ottawa
College, 1 year or more
College, 1 year or more Comparison
Immigrants from Bosnia and Herzegovina
Ottawa
59.2%
COLLEGE, 1 YEAR OR MORE
42.8/ 100
METRIC RATING
182nd/ 347
METRIC RANK
54.9%
COLLEGE, 1 YEAR OR MORE
0.3/ 100
METRIC RATING
261st/ 347
METRIC RANK
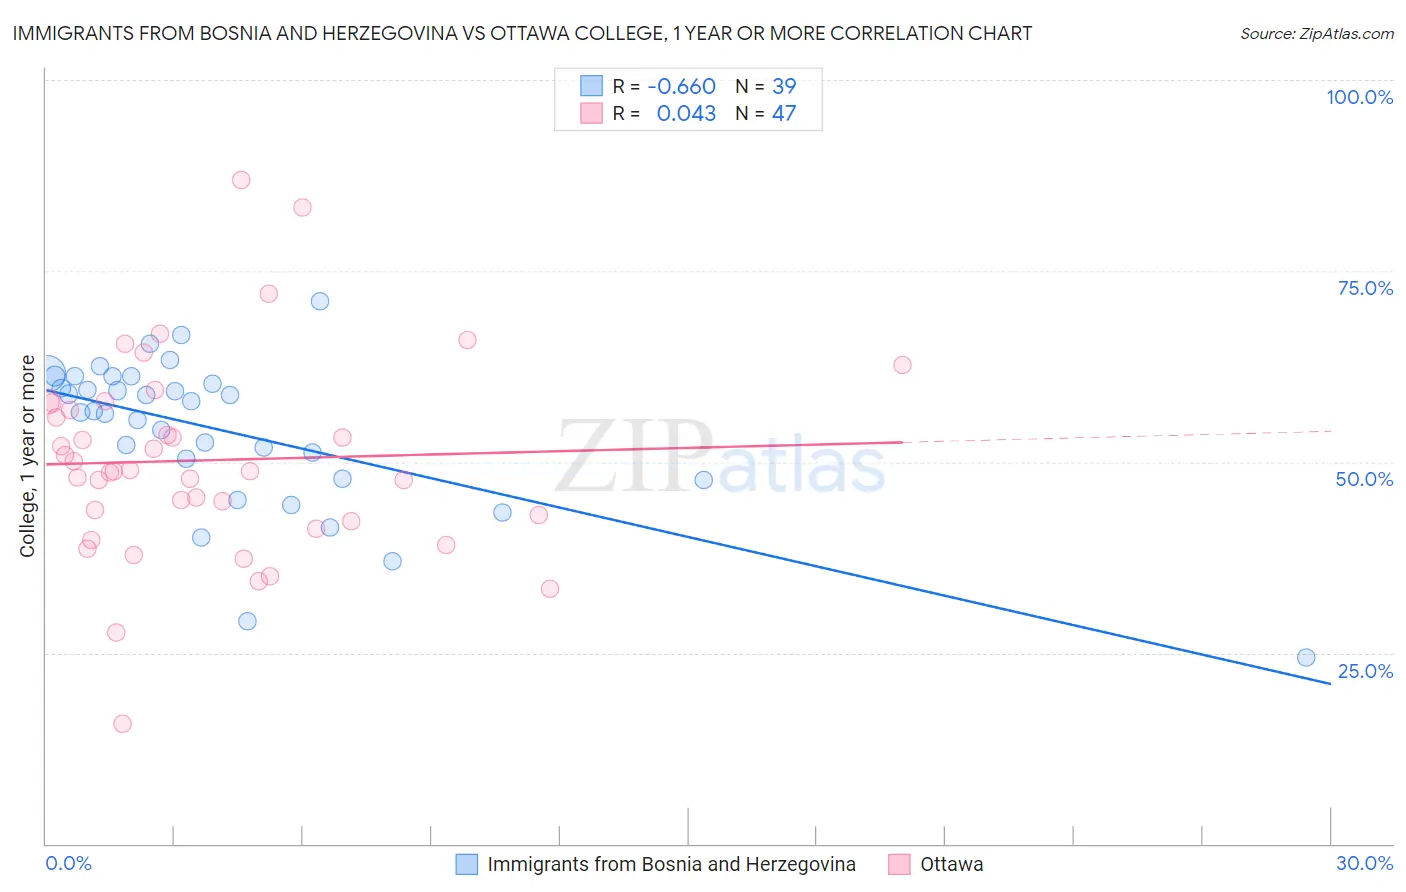
Immigrants from Bosnia and Herzegovina vs Ottawa College, 1 year or more Correlation Chart
The statistical analysis conducted on geographies consisting of 156,819,513 people shows a significant negative correlation between the proportion of Immigrants from Bosnia and Herzegovina and percentage of population with at least college, 1 year or more education in the United States with a correlation coefficient (R) of -0.660 and weighted average of 59.2%. Similarly, the statistical analysis conducted on geographies consisting of 49,956,602 people shows no correlation between the proportion of Ottawa and percentage of population with at least college, 1 year or more education in the United States with a correlation coefficient (R) of 0.043 and weighted average of 54.9%, a difference of 7.9%.
College, 1 year or more Correlation Summary
| Measurement | Immigrants from Bosnia and Herzegovina | Ottawa |
| Minimum | 24.4% | 15.7% |
| Maximum | 71.0% | 86.9% |
| Range | 46.6% | 71.3% |
| Mean | 54.0% | 50.2% |
| Median | 56.6% | 48.8% |
| Interquartile 25% (IQ1) | 47.7% | 42.2% |
| Interquartile 75% (IQ3) | 61.2% | 57.7% |
| Interquartile Range (IQR) | 13.5% | 15.5% |
| Standard Deviation (Sample) | 10.0% | 13.1% |
| Standard Deviation (Population) | 9.9% | 13.0% |
Similar Demographics by College, 1 year or more
Demographics Similar to Immigrants from Bosnia and Herzegovina by College, 1 year or more
In terms of college, 1 year or more, the demographic groups most similar to Immigrants from Bosnia and Herzegovina are Swiss (59.2%, a difference of 0.030%), Yugoslavian (59.2%, a difference of 0.070%), German Russian (59.1%, a difference of 0.19%), Bermudan (59.3%, a difference of 0.21%), and Spaniard (59.0%, a difference of 0.25%).
| Demographics | Rating | Rank | College, 1 year or more |
| Sri Lankans | 49.0 /100 | #175 | Average 59.4% |
| Immigrants | Poland | 48.9 /100 | #176 | Average 59.4% |
| Tlingit-Haida | 48.4 /100 | #177 | Average 59.4% |
| Czechoslovakians | 48.3 /100 | #178 | Average 59.4% |
| Bermudans | 46.6 /100 | #179 | Average 59.3% |
| Yugoslavians | 44.1 /100 | #180 | Average 59.2% |
| Swiss | 43.4 /100 | #181 | Average 59.2% |
| Immigrants | Bosnia and Herzegovina | 42.8 /100 | #182 | Average 59.2% |
| German Russians | 39.3 /100 | #183 | Fair 59.1% |
| Spaniards | 38.3 /100 | #184 | Fair 59.0% |
| South Americans | 35.9 /100 | #185 | Fair 59.0% |
| Scotch-Irish | 34.7 /100 | #186 | Fair 58.9% |
| Germans | 34.7 /100 | #187 | Fair 58.9% |
| French | 34.4 /100 | #188 | Fair 58.9% |
| Uruguayans | 31.8 /100 | #189 | Fair 58.8% |
Demographics Similar to Ottawa by College, 1 year or more
In terms of college, 1 year or more, the demographic groups most similar to Ottawa are Jamaican (54.9%, a difference of 0.030%), Immigrants from St. Vincent and the Grenadines (54.8%, a difference of 0.080%), U.S. Virgin Islander (54.8%, a difference of 0.11%), Nepalese (54.9%, a difference of 0.13%), and Immigrants from Micronesia (54.8%, a difference of 0.13%).
| Demographics | Rating | Rank | College, 1 year or more |
| Japanese | 0.5 /100 | #254 | Tragic 55.2% |
| Immigrants | Bahamas | 0.5 /100 | #255 | Tragic 55.2% |
| Immigrants | West Indies | 0.5 /100 | #256 | Tragic 55.2% |
| Indonesians | 0.4 /100 | #257 | Tragic 55.1% |
| Africans | 0.4 /100 | #258 | Tragic 55.0% |
| Nepalese | 0.3 /100 | #259 | Tragic 54.9% |
| Jamaicans | 0.3 /100 | #260 | Tragic 54.9% |
| Ottawa | 0.3 /100 | #261 | Tragic 54.9% |
| Immigrants | St. Vincent and the Grenadines | 0.3 /100 | #262 | Tragic 54.8% |
| U.S. Virgin Islanders | 0.3 /100 | #263 | Tragic 54.8% |
| Immigrants | Micronesia | 0.3 /100 | #264 | Tragic 54.8% |
| Immigrants | Laos | 0.2 /100 | #265 | Tragic 54.7% |
| Potawatomi | 0.2 /100 | #266 | Tragic 54.6% |
| Blackfeet | 0.2 /100 | #267 | Tragic 54.6% |
| British West Indians | 0.2 /100 | #268 | Tragic 54.5% |