Immigrants from Belize vs Ghanaian Bachelor's Degree
COMPARE
Immigrants from Belize
Ghanaian
Bachelor's Degree
Bachelor's Degree Comparison
Immigrants from Belize
Ghanaians
32.1%
BACHELOR'S DEGREE
0.2/ 100
METRIC RATING
269th/ 347
METRIC RANK
38.0%
BACHELOR'S DEGREE
55.3/ 100
METRIC RATING
169th/ 347
METRIC RANK
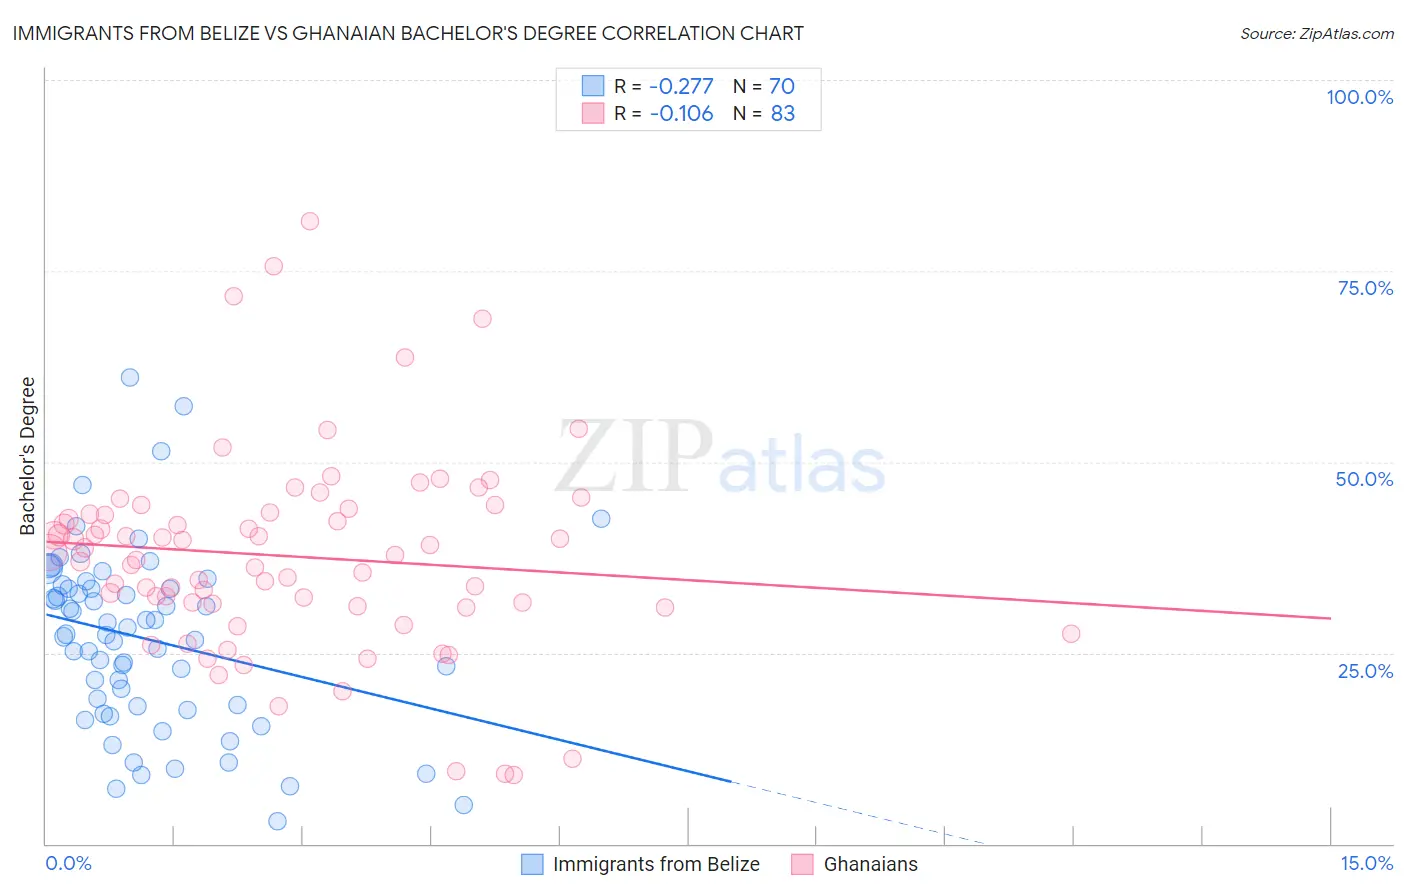
Immigrants from Belize vs Ghanaian Bachelor's Degree Correlation Chart
The statistical analysis conducted on geographies consisting of 130,322,630 people shows a weak negative correlation between the proportion of Immigrants from Belize and percentage of population with at least bachelor's degree education in the United States with a correlation coefficient (R) of -0.277 and weighted average of 32.1%. Similarly, the statistical analysis conducted on geographies consisting of 190,675,931 people shows a poor negative correlation between the proportion of Ghanaians and percentage of population with at least bachelor's degree education in the United States with a correlation coefficient (R) of -0.106 and weighted average of 38.0%, a difference of 18.4%.
Bachelor's Degree Correlation Summary
| Measurement | Immigrants from Belize | Ghanaian |
| Minimum | 2.9% | 9.1% |
| Maximum | 61.0% | 81.5% |
| Range | 58.1% | 72.4% |
| Mean | 26.8% | 37.6% |
| Median | 27.4% | 37.7% |
| Interquartile 25% (IQ1) | 18.1% | 31.1% |
| Interquartile 75% (IQ3) | 33.5% | 43.4% |
| Interquartile Range (IQR) | 15.4% | 12.4% |
| Standard Deviation (Sample) | 11.8% | 13.2% |
| Standard Deviation (Population) | 11.7% | 13.1% |
Similar Demographics by Bachelor's Degree
Demographics Similar to Immigrants from Belize by Bachelor's Degree
In terms of bachelor's degree, the demographic groups most similar to Immigrants from Belize are Immigrants from Portugal (32.2%, a difference of 0.41%), Immigrants from Nicaragua (31.9%, a difference of 0.54%), Central American (31.9%, a difference of 0.63%), Comanche (31.9%, a difference of 0.66%), and American (31.9%, a difference of 0.78%).
| Demographics | Rating | Rank | Bachelor's Degree |
| Immigrants | Jamaica | 0.5 /100 | #262 | Tragic 32.9% |
| Belizeans | 0.4 /100 | #263 | Tragic 32.8% |
| Central American Indians | 0.3 /100 | #264 | Tragic 32.5% |
| Bahamians | 0.3 /100 | #265 | Tragic 32.5% |
| Immigrants | Dominica | 0.3 /100 | #266 | Tragic 32.5% |
| Cubans | 0.3 /100 | #267 | Tragic 32.5% |
| Immigrants | Portugal | 0.2 /100 | #268 | Tragic 32.2% |
| Immigrants | Belize | 0.2 /100 | #269 | Tragic 32.1% |
| Immigrants | Nicaragua | 0.2 /100 | #270 | Tragic 31.9% |
| Central Americans | 0.2 /100 | #271 | Tragic 31.9% |
| Comanche | 0.2 /100 | #272 | Tragic 31.9% |
| Americans | 0.2 /100 | #273 | Tragic 31.9% |
| Potawatomi | 0.2 /100 | #274 | Tragic 31.9% |
| Samoans | 0.1 /100 | #275 | Tragic 31.8% |
| Salvadorans | 0.1 /100 | #276 | Tragic 31.8% |
Demographics Similar to Ghanaians by Bachelor's Degree
In terms of bachelor's degree, the demographic groups most similar to Ghanaians are Danish (38.1%, a difference of 0.090%), Czech (38.0%, a difference of 0.10%), Bermudan (38.0%, a difference of 0.11%), Scottish (38.1%, a difference of 0.12%), and Immigrants from Somalia (37.9%, a difference of 0.25%).
| Demographics | Rating | Rank | Bachelor's Degree |
| Colombians | 65.0 /100 | #162 | Good 38.4% |
| Peruvians | 63.4 /100 | #163 | Good 38.3% |
| Hungarians | 62.1 /100 | #164 | Good 38.3% |
| Sri Lankans | 59.1 /100 | #165 | Average 38.2% |
| Somalis | 58.6 /100 | #166 | Average 38.1% |
| Scottish | 56.6 /100 | #167 | Average 38.1% |
| Danes | 56.2 /100 | #168 | Average 38.1% |
| Ghanaians | 55.3 /100 | #169 | Average 38.0% |
| Czechs | 54.4 /100 | #170 | Average 38.0% |
| Bermudans | 54.2 /100 | #171 | Average 38.0% |
| Immigrants | Somalia | 52.8 /100 | #172 | Average 37.9% |
| Immigrants | Iraq | 52.5 /100 | #173 | Average 37.9% |
| Immigrants | Bangladesh | 50.0 /100 | #174 | Average 37.8% |
| Immigrants | Uruguay | 48.3 /100 | #175 | Average 37.8% |
| Costa Ricans | 47.6 /100 | #176 | Average 37.7% |