Immigrants from Belize vs Ghanaian Professional Degree
COMPARE
Immigrants from Belize
Ghanaian
Professional Degree
Professional Degree Comparison
Immigrants from Belize
Ghanaians
3.5%
PROFESSIONAL DEGREE
0.3/ 100
METRIC RATING
292nd/ 347
METRIC RANK
4.3%
PROFESSIONAL DEGREE
27.3/ 100
METRIC RATING
192nd/ 347
METRIC RANK
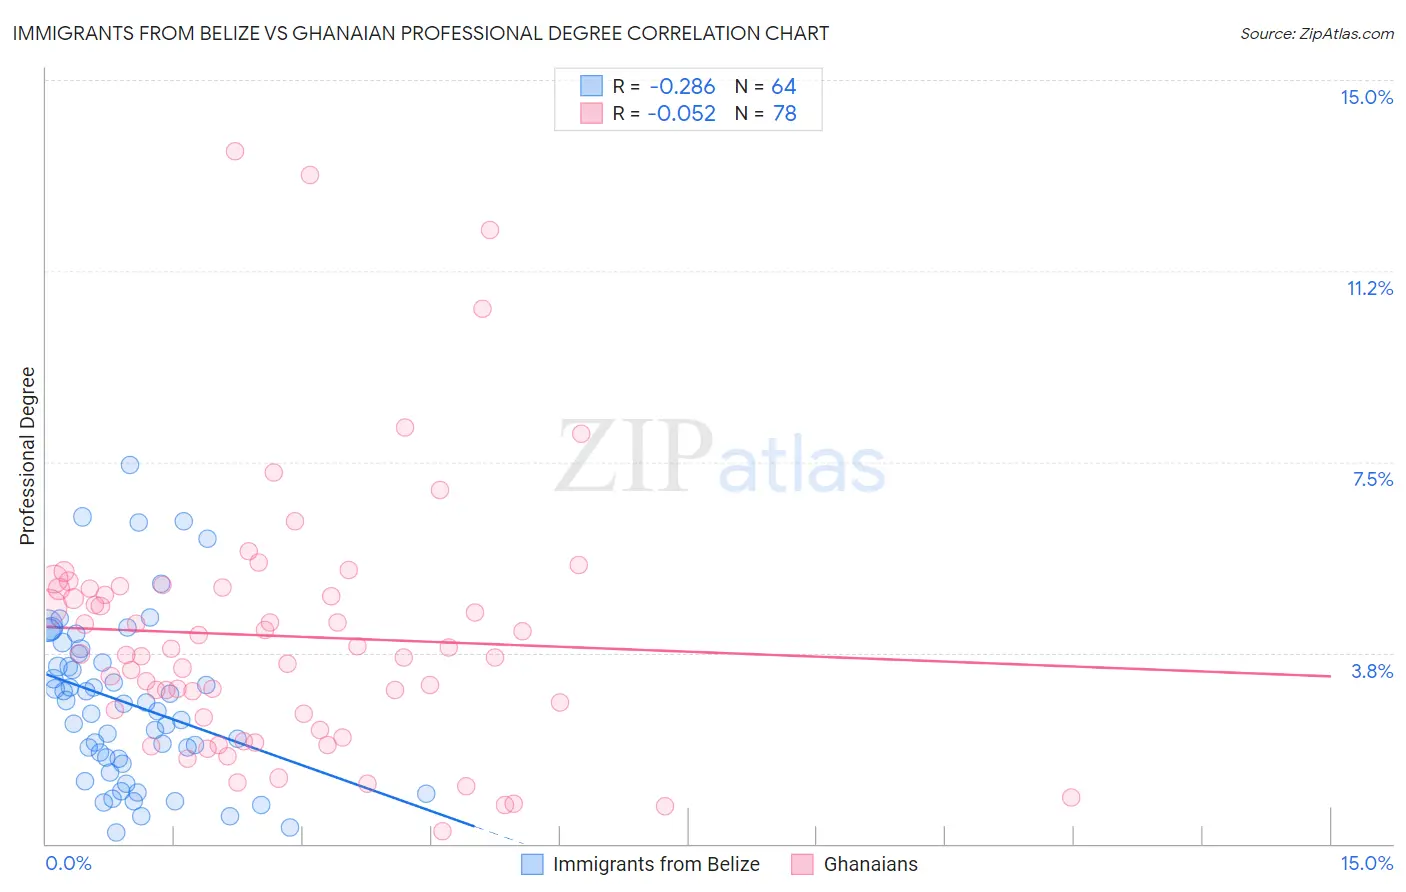
Immigrants from Belize vs Ghanaian Professional Degree Correlation Chart
The statistical analysis conducted on geographies consisting of 130,267,931 people shows a weak negative correlation between the proportion of Immigrants from Belize and percentage of population with at least professional degree education in the United States with a correlation coefficient (R) of -0.286 and weighted average of 3.5%. Similarly, the statistical analysis conducted on geographies consisting of 190,481,529 people shows a slight negative correlation between the proportion of Ghanaians and percentage of population with at least professional degree education in the United States with a correlation coefficient (R) of -0.052 and weighted average of 4.3%, a difference of 22.8%.
Professional Degree Correlation Summary
| Measurement | Immigrants from Belize | Ghanaian |
| Minimum | 0.23% | 0.25% |
| Maximum | 7.4% | 13.6% |
| Range | 7.2% | 13.4% |
| Mean | 2.8% | 4.1% |
| Median | 2.7% | 3.7% |
| Interquartile 25% (IQ1) | 1.6% | 2.5% |
| Interquartile 75% (IQ3) | 3.7% | 5.0% |
| Interquartile Range (IQR) | 2.0% | 2.5% |
| Standard Deviation (Sample) | 1.6% | 2.6% |
| Standard Deviation (Population) | 1.6% | 2.6% |
Similar Demographics by Professional Degree
Demographics Similar to Immigrants from Belize by Professional Degree
In terms of professional degree, the demographic groups most similar to Immigrants from Belize are Alaska Native (3.5%, a difference of 0.070%), Chippewa (3.5%, a difference of 0.24%), Immigrants from Honduras (3.5%, a difference of 0.24%), Guatemalan (3.5%, a difference of 0.25%), and Paiute (3.4%, a difference of 0.32%).
| Demographics | Rating | Rank | Professional Degree |
| Hondurans | 0.3 /100 | #285 | Tragic 3.5% |
| Haitians | 0.3 /100 | #286 | Tragic 3.5% |
| Immigrants | El Salvador | 0.3 /100 | #287 | Tragic 3.5% |
| Blackfeet | 0.3 /100 | #288 | Tragic 3.5% |
| Guatemalans | 0.3 /100 | #289 | Tragic 3.5% |
| Chippewa | 0.3 /100 | #290 | Tragic 3.5% |
| Alaska Natives | 0.3 /100 | #291 | Tragic 3.5% |
| Immigrants | Belize | 0.3 /100 | #292 | Tragic 3.5% |
| Immigrants | Honduras | 0.3 /100 | #293 | Tragic 3.5% |
| Paiute | 0.3 /100 | #294 | Tragic 3.4% |
| Immigrants | Guatemala | 0.2 /100 | #295 | Tragic 3.4% |
| Hawaiians | 0.2 /100 | #296 | Tragic 3.4% |
| Immigrants | Liberia | 0.2 /100 | #297 | Tragic 3.4% |
| Ottawa | 0.2 /100 | #298 | Tragic 3.4% |
| Immigrants | Yemen | 0.2 /100 | #299 | Tragic 3.4% |
Demographics Similar to Ghanaians by Professional Degree
In terms of professional degree, the demographic groups most similar to Ghanaians are French (4.2%, a difference of 0.040%), Scandinavian (4.2%, a difference of 0.29%), Sri Lankan (4.3%, a difference of 0.32%), Immigrants from Poland (4.3%, a difference of 0.36%), and Nigerian (4.2%, a difference of 0.53%).
| Demographics | Rating | Rank | Professional Degree |
| Welsh | 35.8 /100 | #185 | Fair 4.3% |
| Scotch-Irish | 34.2 /100 | #186 | Fair 4.3% |
| Immigrants | Cameroon | 33.3 /100 | #187 | Fair 4.3% |
| Immigrants | Thailand | 31.7 /100 | #188 | Fair 4.3% |
| Slovaks | 30.7 /100 | #189 | Fair 4.3% |
| Immigrants | Poland | 29.2 /100 | #190 | Fair 4.3% |
| Sri Lankans | 29.0 /100 | #191 | Fair 4.3% |
| Ghanaians | 27.3 /100 | #192 | Fair 4.3% |
| French | 27.1 /100 | #193 | Fair 4.2% |
| Scandinavians | 25.8 /100 | #194 | Fair 4.2% |
| Nigerians | 24.6 /100 | #195 | Fair 4.2% |
| Spanish | 23.0 /100 | #196 | Fair 4.2% |
| Czechoslovakians | 22.4 /100 | #197 | Fair 4.2% |
| Immigrants | Middle Africa | 22.1 /100 | #198 | Fair 4.2% |
| Norwegians | 20.5 /100 | #199 | Fair 4.2% |