Inupiat vs Ghanaian Bachelor's Degree
COMPARE
Inupiat
Ghanaian
Bachelor's Degree
Bachelor's Degree Comparison
Inupiat
Ghanaians
25.8%
BACHELOR'S DEGREE
0.0/ 100
METRIC RATING
337th/ 347
METRIC RANK
38.0%
BACHELOR'S DEGREE
55.3/ 100
METRIC RATING
169th/ 347
METRIC RANK
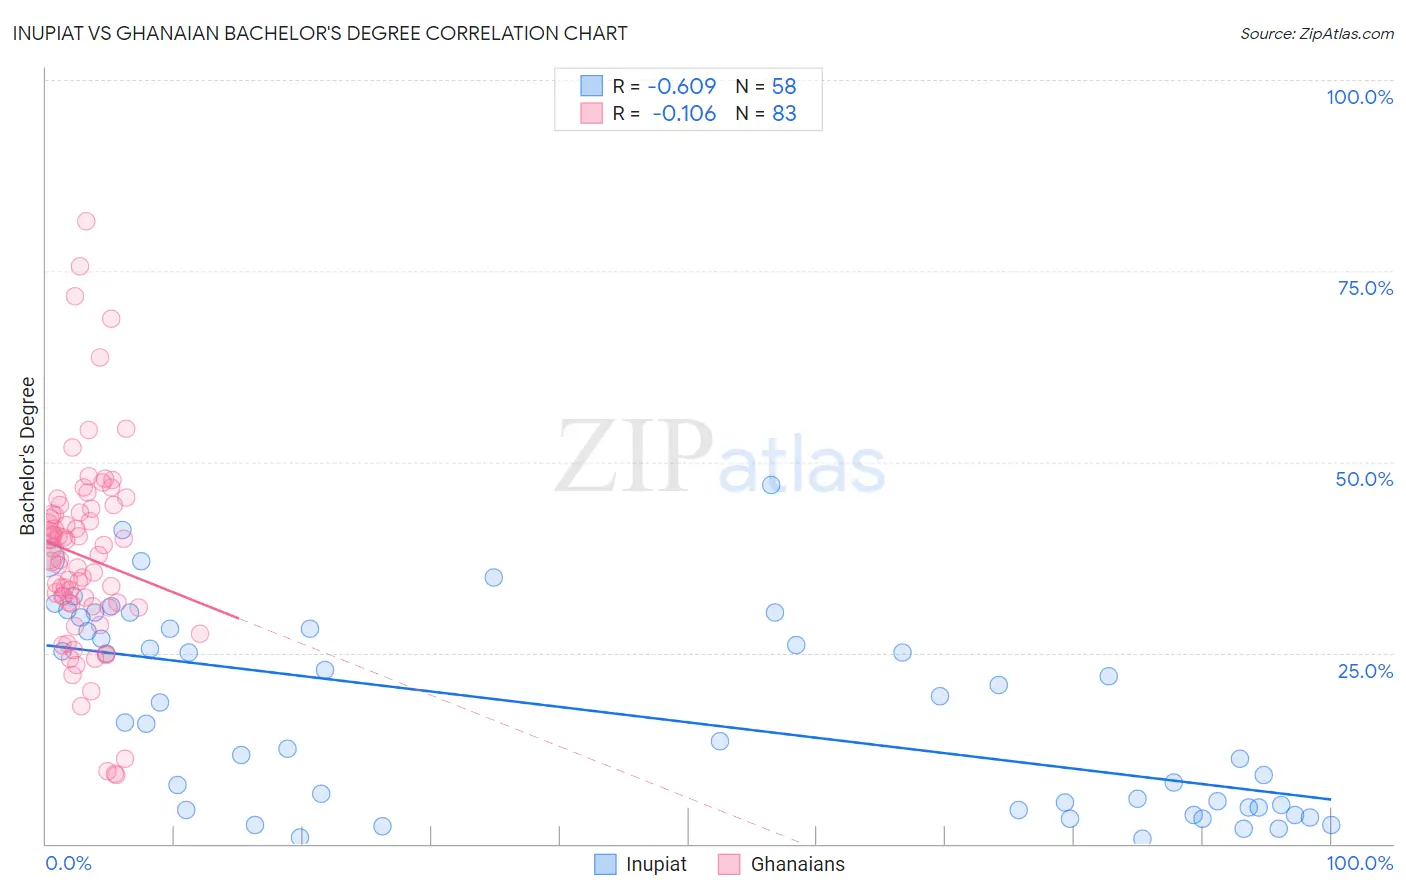
Inupiat vs Ghanaian Bachelor's Degree Correlation Chart
The statistical analysis conducted on geographies consisting of 96,347,168 people shows a significant negative correlation between the proportion of Inupiat and percentage of population with at least bachelor's degree education in the United States with a correlation coefficient (R) of -0.609 and weighted average of 25.8%. Similarly, the statistical analysis conducted on geographies consisting of 190,675,931 people shows a poor negative correlation between the proportion of Ghanaians and percentage of population with at least bachelor's degree education in the United States with a correlation coefficient (R) of -0.106 and weighted average of 38.0%, a difference of 47.3%.
Bachelor's Degree Correlation Summary
| Measurement | Inupiat | Ghanaian |
| Minimum | 0.66% | 9.1% |
| Maximum | 47.0% | 81.5% |
| Range | 46.4% | 72.4% |
| Mean | 17.1% | 37.6% |
| Median | 15.8% | 37.7% |
| Interquartile 25% (IQ1) | 4.7% | 31.1% |
| Interquartile 75% (IQ3) | 28.1% | 43.4% |
| Interquartile Range (IQR) | 23.4% | 12.4% |
| Standard Deviation (Sample) | 12.7% | 13.2% |
| Standard Deviation (Population) | 12.6% | 13.1% |
Similar Demographics by Bachelor's Degree
Demographics Similar to Inupiat by Bachelor's Degree
In terms of bachelor's degree, the demographic groups most similar to Inupiat are Pueblo (25.5%, a difference of 1.1%), Immigrants from Mexico (26.1%, a difference of 1.3%), Native/Alaskan (26.3%, a difference of 2.0%), Hopi (25.3%, a difference of 2.0%), and Arapaho (26.6%, a difference of 3.2%).
| Demographics | Rating | Rank | Bachelor's Degree |
| Spanish American Indians | 0.0 /100 | #330 | Tragic 27.5% |
| Immigrants | Azores | 0.0 /100 | #331 | Tragic 27.3% |
| Menominee | 0.0 /100 | #332 | Tragic 27.3% |
| Mexicans | 0.0 /100 | #333 | Tragic 27.1% |
| Arapaho | 0.0 /100 | #334 | Tragic 26.6% |
| Natives/Alaskans | 0.0 /100 | #335 | Tragic 26.3% |
| Immigrants | Mexico | 0.0 /100 | #336 | Tragic 26.1% |
| Inupiat | 0.0 /100 | #337 | Tragic 25.8% |
| Pueblo | 0.0 /100 | #338 | Tragic 25.5% |
| Hopi | 0.0 /100 | #339 | Tragic 25.3% |
| Lumbee | 0.0 /100 | #340 | Tragic 24.8% |
| Yuman | 0.0 /100 | #341 | Tragic 24.5% |
| Yakama | 0.0 /100 | #342 | Tragic 24.5% |
| Tohono O'odham | 0.0 /100 | #343 | Tragic 24.4% |
| Navajo | 0.0 /100 | #344 | Tragic 23.6% |
Demographics Similar to Ghanaians by Bachelor's Degree
In terms of bachelor's degree, the demographic groups most similar to Ghanaians are Danish (38.1%, a difference of 0.090%), Czech (38.0%, a difference of 0.10%), Bermudan (38.0%, a difference of 0.11%), Scottish (38.1%, a difference of 0.12%), and Immigrants from Somalia (37.9%, a difference of 0.25%).
| Demographics | Rating | Rank | Bachelor's Degree |
| Colombians | 65.0 /100 | #162 | Good 38.4% |
| Peruvians | 63.4 /100 | #163 | Good 38.3% |
| Hungarians | 62.1 /100 | #164 | Good 38.3% |
| Sri Lankans | 59.1 /100 | #165 | Average 38.2% |
| Somalis | 58.6 /100 | #166 | Average 38.1% |
| Scottish | 56.6 /100 | #167 | Average 38.1% |
| Danes | 56.2 /100 | #168 | Average 38.1% |
| Ghanaians | 55.3 /100 | #169 | Average 38.0% |
| Czechs | 54.4 /100 | #170 | Average 38.0% |
| Bermudans | 54.2 /100 | #171 | Average 38.0% |
| Immigrants | Somalia | 52.8 /100 | #172 | Average 37.9% |
| Immigrants | Iraq | 52.5 /100 | #173 | Average 37.9% |
| Immigrants | Bangladesh | 50.0 /100 | #174 | Average 37.8% |
| Immigrants | Uruguay | 48.3 /100 | #175 | Average 37.8% |
| Costa Ricans | 47.6 /100 | #176 | Average 37.7% |