Immigrants from Belgium vs Swedish GED/Equivalency
COMPARE
Immigrants from Belgium
Swedish
GED/Equivalency
GED/Equivalency Comparison
Immigrants from Belgium
Swedes
88.3%
GED/EQUIVALENCY
99.7/ 100
METRIC RATING
36th/ 347
METRIC RANK
88.8%
GED/EQUIVALENCY
99.9/ 100
METRIC RATING
19th/ 347
METRIC RANK
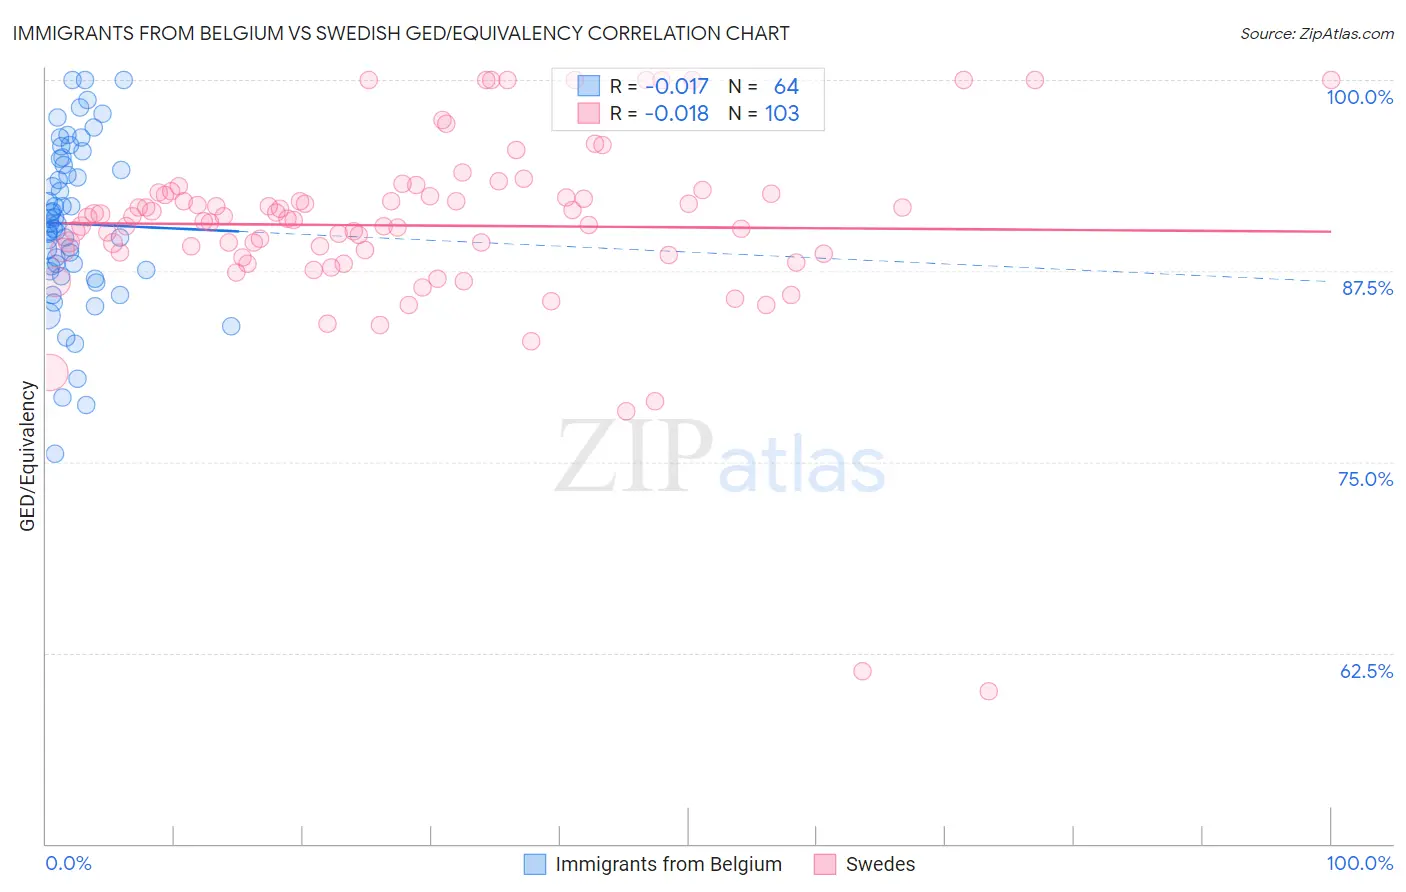
Immigrants from Belgium vs Swedish GED/Equivalency Correlation Chart
The statistical analysis conducted on geographies consisting of 146,727,159 people shows no correlation between the proportion of Immigrants from Belgium and percentage of population with at least ged/equivalency education in the United States with a correlation coefficient (R) of -0.017 and weighted average of 88.3%. Similarly, the statistical analysis conducted on geographies consisting of 539,231,677 people shows no correlation between the proportion of Swedes and percentage of population with at least ged/equivalency education in the United States with a correlation coefficient (R) of -0.018 and weighted average of 88.8%, a difference of 0.46%.
GED/Equivalency Correlation Summary
| Measurement | Immigrants from Belgium | Swedish |
| Minimum | 75.5% | 60.0% |
| Maximum | 100.0% | 100.0% |
| Range | 24.5% | 40.0% |
| Mean | 90.6% | 90.5% |
| Median | 90.6% | 90.9% |
| Interquartile 25% (IQ1) | 87.5% | 88.6% |
| Interquartile 75% (IQ3) | 94.6% | 92.6% |
| Interquartile Range (IQR) | 7.1% | 4.0% |
| Standard Deviation (Sample) | 5.4% | 6.1% |
| Standard Deviation (Population) | 5.3% | 6.1% |
Demographics Similar to Immigrants from Belgium and Swedes by GED/Equivalency
In terms of ged/equivalency, the demographic groups most similar to Immigrants from Belgium are Immigrants from South Central Asia (88.4%, a difference of 0.020%), Immigrants from Austria (88.3%, a difference of 0.030%), Immigrants from Japan (88.4%, a difference of 0.040%), Immigrants from Sweden (88.4%, a difference of 0.050%), and Danish (88.4%, a difference of 0.090%). Similarly, the demographic groups most similar to Swedes are Slovene (88.8%, a difference of 0.050%), Croatian (88.8%, a difference of 0.080%), Maltese (88.6%, a difference of 0.15%), Luxembourger (88.6%, a difference of 0.16%), and Immigrants from Ireland (88.6%, a difference of 0.17%).
| Demographics | Rating | Rank | GED/Equivalency |
| Croatians | 99.9 /100 | #17 | Exceptional 88.8% |
| Slovenes | 99.9 /100 | #18 | Exceptional 88.8% |
| Swedes | 99.9 /100 | #19 | Exceptional 88.8% |
| Maltese | 99.9 /100 | #20 | Exceptional 88.6% |
| Luxembourgers | 99.8 /100 | #21 | Exceptional 88.6% |
| Immigrants | Ireland | 99.8 /100 | #22 | Exceptional 88.6% |
| Russians | 99.8 /100 | #23 | Exceptional 88.6% |
| Slovaks | 99.8 /100 | #24 | Exceptional 88.6% |
| Estonians | 99.8 /100 | #25 | Exceptional 88.6% |
| Immigrants | Australia | 99.8 /100 | #26 | Exceptional 88.6% |
| Immigrants | Lithuania | 99.8 /100 | #27 | Exceptional 88.6% |
| Immigrants | Northern Europe | 99.8 /100 | #28 | Exceptional 88.5% |
| Poles | 99.8 /100 | #29 | Exceptional 88.5% |
| Turks | 99.8 /100 | #30 | Exceptional 88.5% |
| Bhutanese | 99.8 /100 | #31 | Exceptional 88.4% |
| Danes | 99.8 /100 | #32 | Exceptional 88.4% |
| Immigrants | Sweden | 99.7 /100 | #33 | Exceptional 88.4% |
| Immigrants | Japan | 99.7 /100 | #34 | Exceptional 88.4% |
| Immigrants | South Central Asia | 99.7 /100 | #35 | Exceptional 88.4% |
| Immigrants | Belgium | 99.7 /100 | #36 | Exceptional 88.3% |
| Immigrants | Austria | 99.7 /100 | #37 | Exceptional 88.3% |