Immigrants from Belgium vs Finnish GED/Equivalency
COMPARE
Immigrants from Belgium
Finnish
GED/Equivalency
GED/Equivalency Comparison
Immigrants from Belgium
Finns
88.3%
GED/EQUIVALENCY
99.7/ 100
METRIC RATING
36th/ 347
METRIC RANK
88.2%
GED/EQUIVALENCY
99.6/ 100
METRIC RATING
41st/ 347
METRIC RANK
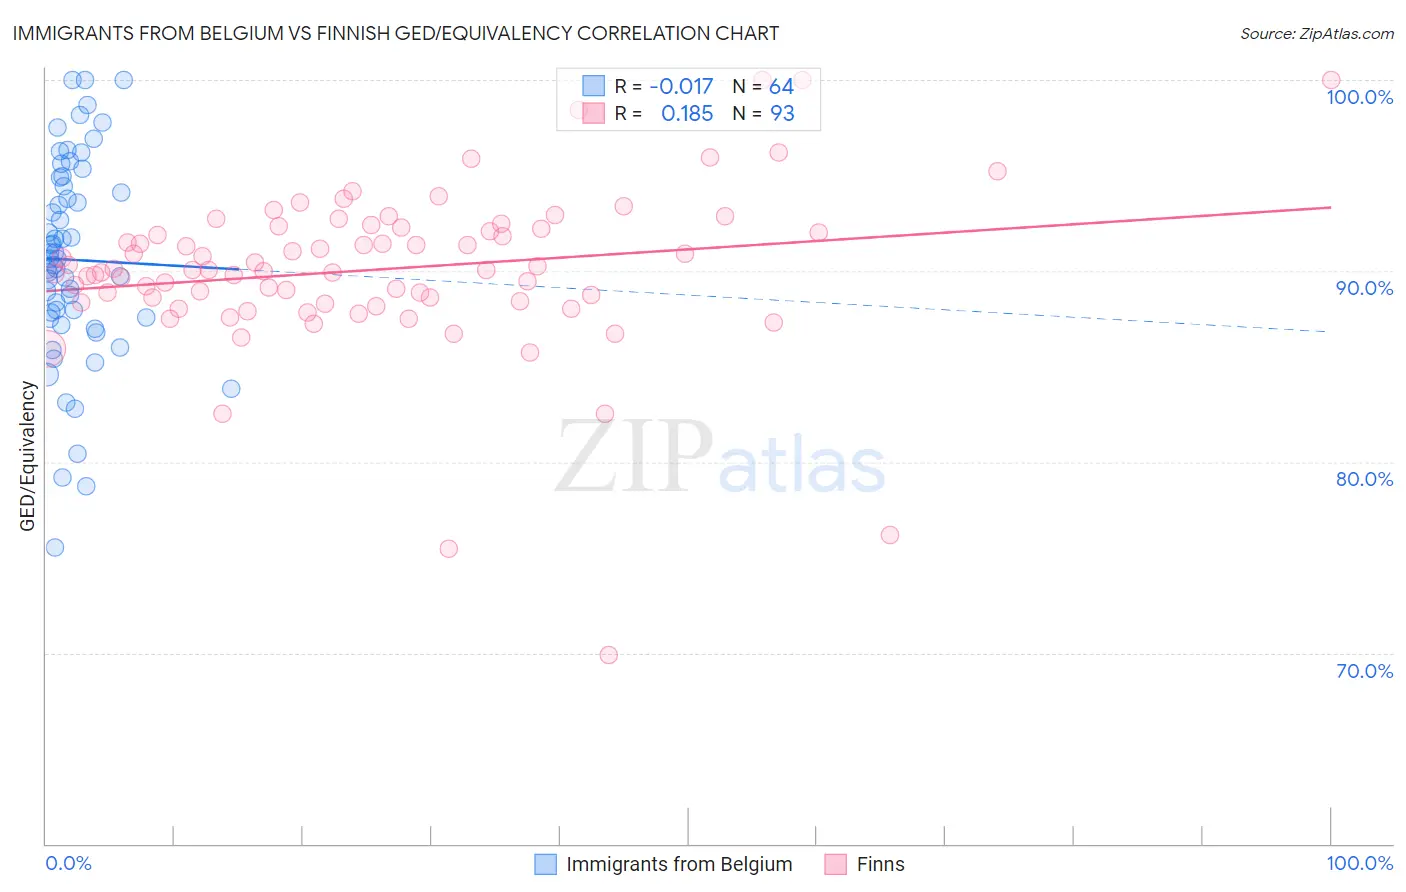
Immigrants from Belgium vs Finnish GED/Equivalency Correlation Chart
The statistical analysis conducted on geographies consisting of 146,727,159 people shows no correlation between the proportion of Immigrants from Belgium and percentage of population with at least ged/equivalency education in the United States with a correlation coefficient (R) of -0.017 and weighted average of 88.3%. Similarly, the statistical analysis conducted on geographies consisting of 404,676,025 people shows a poor positive correlation between the proportion of Finns and percentage of population with at least ged/equivalency education in the United States with a correlation coefficient (R) of 0.185 and weighted average of 88.2%, a difference of 0.18%.
GED/Equivalency Correlation Summary
| Measurement | Immigrants from Belgium | Finnish |
| Minimum | 75.5% | 69.9% |
| Maximum | 100.0% | 100.0% |
| Range | 24.5% | 30.1% |
| Mean | 90.6% | 90.1% |
| Median | 90.6% | 90.1% |
| Interquartile 25% (IQ1) | 87.5% | 88.4% |
| Interquartile 75% (IQ3) | 94.6% | 92.3% |
| Interquartile Range (IQR) | 7.1% | 3.9% |
| Standard Deviation (Sample) | 5.4% | 4.4% |
| Standard Deviation (Population) | 5.3% | 4.3% |
Demographics Similar to Immigrants from Belgium and Finns by GED/Equivalency
In terms of ged/equivalency, the demographic groups most similar to Immigrants from Belgium are Immigrants from South Central Asia (88.4%, a difference of 0.020%), Immigrants from Austria (88.3%, a difference of 0.030%), Immigrants from Japan (88.4%, a difference of 0.040%), Immigrants from Sweden (88.4%, a difference of 0.050%), and Burmese (88.3%, a difference of 0.060%). Similarly, the demographic groups most similar to Finns are Italian (88.2%, a difference of 0.010%), Immigrants from Israel (88.2%, a difference of 0.030%), Cambodian (88.2%, a difference of 0.030%), Immigrants from Scotland (88.2%, a difference of 0.030%), and Macedonian (88.1%, a difference of 0.060%).
| Demographics | Rating | Rank | GED/Equivalency |
| Immigrants | Northern Europe | 99.8 /100 | #28 | Exceptional 88.5% |
| Poles | 99.8 /100 | #29 | Exceptional 88.5% |
| Turks | 99.8 /100 | #30 | Exceptional 88.5% |
| Bhutanese | 99.8 /100 | #31 | Exceptional 88.4% |
| Danes | 99.8 /100 | #32 | Exceptional 88.4% |
| Immigrants | Sweden | 99.7 /100 | #33 | Exceptional 88.4% |
| Immigrants | Japan | 99.7 /100 | #34 | Exceptional 88.4% |
| Immigrants | South Central Asia | 99.7 /100 | #35 | Exceptional 88.4% |
| Immigrants | Belgium | 99.7 /100 | #36 | Exceptional 88.3% |
| Immigrants | Austria | 99.7 /100 | #37 | Exceptional 88.3% |
| Burmese | 99.7 /100 | #38 | Exceptional 88.3% |
| Immigrants | Israel | 99.6 /100 | #39 | Exceptional 88.2% |
| Italians | 99.6 /100 | #40 | Exceptional 88.2% |
| Finns | 99.6 /100 | #41 | Exceptional 88.2% |
| Cambodians | 99.6 /100 | #42 | Exceptional 88.2% |
| Immigrants | Scotland | 99.6 /100 | #43 | Exceptional 88.2% |
| Macedonians | 99.5 /100 | #44 | Exceptional 88.1% |
| Czechs | 99.5 /100 | #45 | Exceptional 88.1% |
| Immigrants | Switzerland | 99.5 /100 | #46 | Exceptional 88.1% |
| Immigrants | Latvia | 99.5 /100 | #47 | Exceptional 88.1% |
| Greeks | 99.5 /100 | #48 | Exceptional 88.1% |