Immigrants from the Azores vs Nonimmigrants 3rd Grade
COMPARE
Immigrants from the Azores
Nonimmigrants
3rd Grade
3rd Grade Comparison
Immigrants from the Azores
Nonimmigrants
96.6%
3RD GRADE
0.0/ 100
METRIC RATING
315th/ 347
METRIC RANK
98.1%
3RD GRADE
97.8/ 100
METRIC RATING
102nd/ 347
METRIC RANK
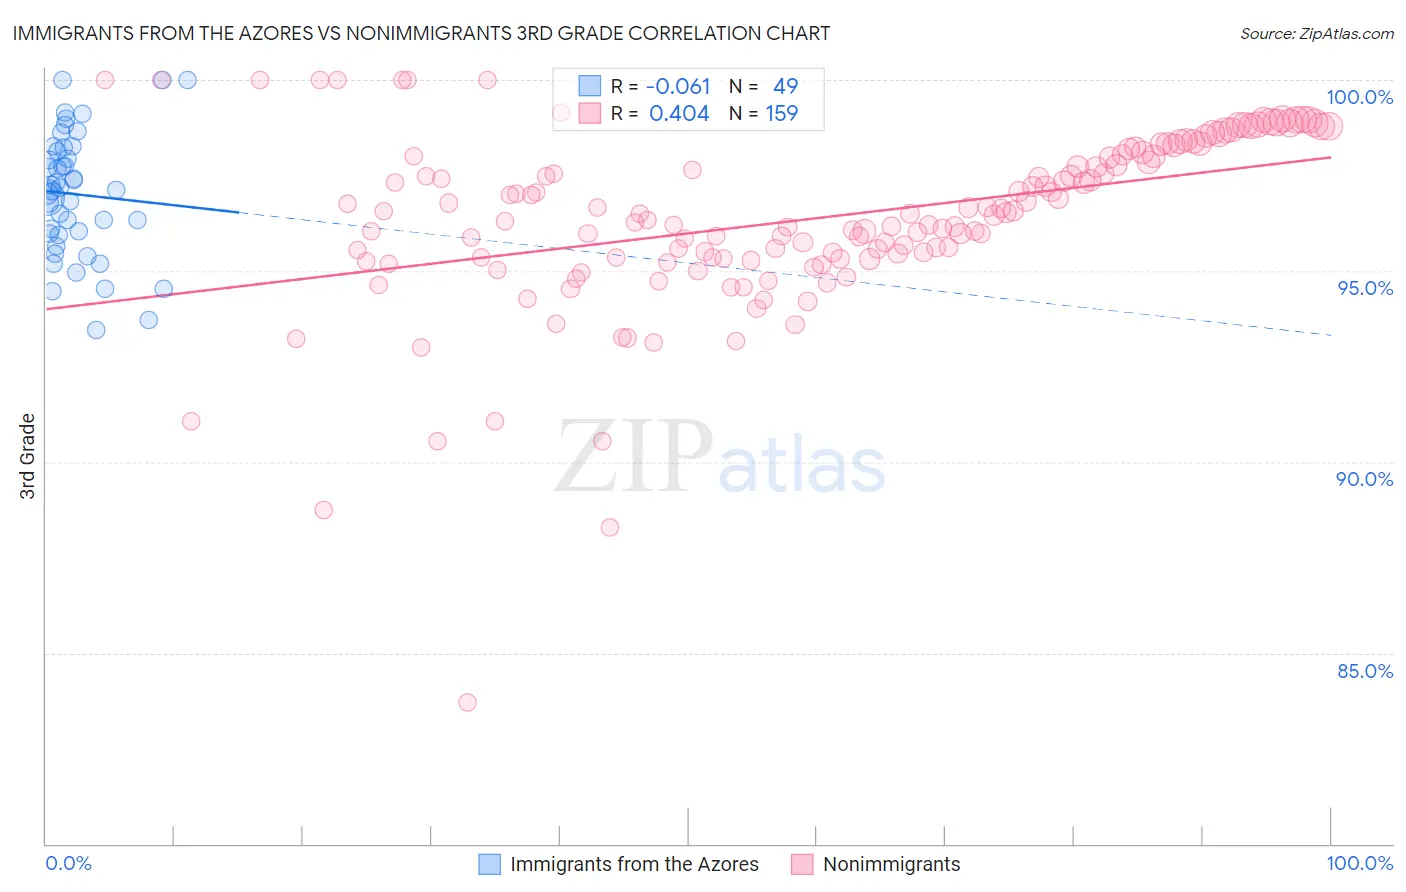
Immigrants from the Azores vs Nonimmigrants 3rd Grade Correlation Chart
The statistical analysis conducted on geographies consisting of 46,257,310 people shows a slight negative correlation between the proportion of Immigrants from the Azores and percentage of population with at least 3rd grade education in the United States with a correlation coefficient (R) of -0.061 and weighted average of 96.6%. Similarly, the statistical analysis conducted on geographies consisting of 585,374,774 people shows a moderate positive correlation between the proportion of Nonimmigrants and percentage of population with at least 3rd grade education in the United States with a correlation coefficient (R) of 0.404 and weighted average of 98.1%, a difference of 1.5%.
3rd Grade Correlation Summary
| Measurement | Immigrants from the Azores | Nonimmigrants |
| Minimum | 93.4% | 83.7% |
| Maximum | 100.0% | 100.0% |
| Range | 6.6% | 16.3% |
| Mean | 97.0% | 96.4% |
| Median | 97.1% | 96.5% |
| Interquartile 25% (IQ1) | 96.0% | 95.3% |
| Interquartile 75% (IQ3) | 98.2% | 98.0% |
| Interquartile Range (IQR) | 2.2% | 2.7% |
| Standard Deviation (Sample) | 1.6% | 2.3% |
| Standard Deviation (Population) | 1.6% | 2.3% |
Similar Demographics by 3rd Grade
Demographics Similar to Immigrants from the Azores by 3rd Grade
In terms of 3rd grade, the demographic groups most similar to Immigrants from the Azores are Immigrants from Ecuador (96.6%, a difference of 0.010%), Belizean (96.6%, a difference of 0.010%), Immigrants from Burma/Myanmar (96.6%, a difference of 0.010%), Immigrants from Laos (96.6%, a difference of 0.020%), and Immigrants from Bangladesh (96.6%, a difference of 0.030%).
| Demographics | Rating | Rank | 3rd Grade |
| Immigrants | Haiti | 0.0 /100 | #308 | Tragic 96.7% |
| Sri Lankans | 0.0 /100 | #309 | Tragic 96.7% |
| Cape Verdeans | 0.0 /100 | #310 | Tragic 96.6% |
| Immigrants | Guyana | 0.0 /100 | #311 | Tragic 96.6% |
| Immigrants | Laos | 0.0 /100 | #312 | Tragic 96.6% |
| Immigrants | Ecuador | 0.0 /100 | #313 | Tragic 96.6% |
| Belizeans | 0.0 /100 | #314 | Tragic 96.6% |
| Immigrants | Azores | 0.0 /100 | #315 | Tragic 96.6% |
| Immigrants | Burma/Myanmar | 0.0 /100 | #316 | Tragic 96.6% |
| Immigrants | Bangladesh | 0.0 /100 | #317 | Tragic 96.6% |
| Hispanics or Latinos | 0.0 /100 | #318 | Tragic 96.5% |
| Vietnamese | 0.0 /100 | #319 | Tragic 96.5% |
| Immigrants | Nicaragua | 0.0 /100 | #320 | Tragic 96.5% |
| Indonesians | 0.0 /100 | #321 | Tragic 96.5% |
| Immigrants | Belize | 0.0 /100 | #322 | Tragic 96.5% |
Demographics Similar to Nonimmigrants by 3rd Grade
In terms of 3rd grade, the demographic groups most similar to Nonimmigrants are Cree (98.1%, a difference of 0.0%), Puget Sound Salish (98.1%, a difference of 0.0%), South African (98.1%, a difference of 0.010%), Choctaw (98.1%, a difference of 0.010%), and Romanian (98.1%, a difference of 0.010%).
| Demographics | Rating | Rank | 3rd Grade |
| Cypriots | 98.4 /100 | #95 | Exceptional 98.1% |
| Immigrants | Ireland | 98.2 /100 | #96 | Exceptional 98.1% |
| South Africans | 98.2 /100 | #97 | Exceptional 98.1% |
| Choctaw | 98.0 /100 | #98 | Exceptional 98.1% |
| Romanians | 98.0 /100 | #99 | Exceptional 98.1% |
| Cree | 97.9 /100 | #100 | Exceptional 98.1% |
| Puget Sound Salish | 97.9 /100 | #101 | Exceptional 98.1% |
| Immigrants | Nonimmigrants | 97.8 /100 | #102 | Exceptional 98.1% |
| Yugoslavians | 97.7 /100 | #103 | Exceptional 98.1% |
| Turks | 97.6 /100 | #104 | Exceptional 98.1% |
| German Russians | 97.2 /100 | #105 | Exceptional 98.1% |
| Bhutanese | 97.2 /100 | #106 | Exceptional 98.1% |
| Immigrants | Czechoslovakia | 97.0 /100 | #107 | Exceptional 98.0% |
| Immigrants | Singapore | 96.7 /100 | #108 | Exceptional 98.0% |
| Pima | 96.7 /100 | #109 | Exceptional 98.0% |