Immigrants from the Azores vs Nonimmigrants 4th Grade

COMPARE

Immigrants from the Azores
Race
Ancestry
AfghanAfricanAlaska NativeAlaskan AthabascanAlbanianAleutAlsatianAmericanApacheArabArapahoArgentineanArmenianAssyrian/Chaldean/SyriacAustralianAustrianBahamianBangladeshiBarbadianBasqueBelgianBelizeanBermudanBhutaneseBlackfeetBolivianBrazilianBritishBritish West IndianBulgarianBurmeseCajunCambodianCanadianCape VerdeanCarpatho RusynCelticCentral AmericanCentral American IndianCherokeeCheyenneChickasawChileanChineseChippewaChoctawColombianColvilleComancheCosta RicanCreeCreekCroatianCrowCubanCypriotCzechCzechoslovakianDanishDelawareDominicanDutchDutch West IndianEastern EuropeanEcuadorianEgyptianEnglishEstonianEthiopianEuropeanFijianFilipinoFinnishFrenchFrench American IndianFrench CanadianGermanGerman RussianGhanaianGreekGuamanian/ChamorroGuatemalanGuyaneseHaitianHmongHonduranHopiHoumaHungarianIcelanderIndian (Asian)IndonesianInupiatIranianIraqiIrishIroquoisIsraeliItalianJamaicanJapaneseJordanianKenyanKiowaKoreanLaotianLatvianLebaneseLiberianLithuanianLumbeeLuxembourgerMacedonianMalaysianMalteseMarshalleseMenomineeMexicanMexican American IndianMongolianMoroccanNative HawaiianNavajoNepaleseNew ZealanderNicaraguanNigerianNorthern EuropeanNorwegianOkinawanOsageOttawaPaiutePakistaniPalestinianPanamanianParaguayanPennsylvania GermanPeruvianPimaPolishPortuguesePotawatomiPuebloPuerto RicanPuget Sound SalishRomanianRussianSalvadoranSamoanScandinavianScotch-IrishScottishSeminoleSenegaleseSerbianShoshoneSierra LeoneanSiouxSlavicSlovakSloveneSomaliSouth AfricanSouth AmericanSouth American IndianSoviet UnionSpaniardSpanishSpanish AmericanSpanish American IndianSri LankanSubsaharan AfricanSudaneseSwedishSwissSyrianTaiwaneseThaiTlingit-HaidaTohono O'OdhamTonganTrinidadian and TobagonianTsimshianTurkishU.S. Virgin IslanderUgandanUkrainianUruguayanUteVenezuelanVietnameseWelshWest IndianYakamaYaquiYugoslavianYumanYup'ikZimbabwean
Immigration
ImmigrantsAfghanistanAfricaAlbaniaArgentinaArmeniaAsiaAustraliaAustriaBahamasBangladeshBarbadosBelarusBelgiumBelizeBoliviaBosnia and HerzegovinaBrazilBulgariaBurma/MyanmarCabo VerdeCambodiaCameroonCanadaCaribbeanCentral AmericaChileChinaColombiaCongoCosta RicaCroatiaCubaCzechoslovakiaDenmarkDominicaDominican RepublicEastern AfricaEastern AsiaEastern EuropeEcuadorEgyptEl SalvadorEnglandEritreaEthiopiaEuropeFijiFranceGermanyGhanaGreeceGrenadaGuatemalaGuyanaHaitiHondurasHong KongHungaryIndiaIndonesiaIranIraqIrelandIsraelItalyJamaicaJapanJordanKazakhstanKenyaKoreaKuwaitLaosLatin AmericaLatviaLebanonLiberiaLithuaniaMalaysiaMexicoMicronesiaMiddle AfricaMoldovaMoroccoNepalNetherlandsNicaraguaNigeriaNorth AmericaNorth MacedoniaNorthern AfricaNorthern EuropeNorwayOceaniaPakistanPanamaPeruPhilippinesPolandPortugalRomaniaRussiaSaudi ArabiaScotlandSenegalSerbiaSierra LeoneSingaporeSomaliaSouth AfricaSouth AmericaSouth Central AsiaSouth Eastern AsiaSouthern EuropeSpainSri LankaSt. Vincent and the GrenadinesSudanSwedenSwitzerlandSyriaTaiwanThailandTrinidad and TobagoTurkeyUgandaUkraineUruguayUzbekistanVenezuelaVietnamWest IndiesWestern AfricaWestern AsiaWestern EuropeYemenZaireZimbabweAzores
Nonimmigrants
Race
Ancestry
AfghanAfricanAlaska NativeAlaskan AthabascanAlbanianAleutAlsatianAmericanApacheArabArapahoArgentineanArmenianAssyrian/Chaldean/SyriacAustralianAustrianBahamianBangladeshiBarbadianBasqueBelgianBelizeanBermudanBhutaneseBlackfeetBolivianBrazilianBritishBritish West IndianBulgarianBurmeseCajunCambodianCanadianCape VerdeanCarpatho RusynCelticCentral AmericanCentral American IndianCherokeeCheyenneChickasawChileanChineseChippewaChoctawColombianColvilleComancheCosta RicanCreeCreekCroatianCrowCubanCypriotCzechCzechoslovakianDanishDelawareDominicanDutchDutch West IndianEastern EuropeanEcuadorianEgyptianEnglishEstonianEthiopianEuropeanFijianFilipinoFinnishFrenchFrench American IndianFrench CanadianGermanGerman RussianGhanaianGreekGuamanian/ChamorroGuatemalanGuyaneseHaitianHmongHonduranHopiHoumaHungarianIcelanderIndian (Asian)IndonesianInupiatIranianIraqiIrishIroquoisIsraeliItalianJamaicanJapaneseJordanianKenyanKiowaKoreanLaotianLatvianLebaneseLiberianLithuanianLumbeeLuxembourgerMacedonianMalaysianMalteseMarshalleseMenomineeMexicanMexican American IndianMongolianMoroccanNative HawaiianNavajoNepaleseNew ZealanderNicaraguanNigerianNorthern EuropeanNorwegianOkinawanOsageOttawaPaiutePakistaniPalestinianPanamanianParaguayanPennsylvania GermanPeruvianPimaPolishPortuguesePotawatomiPuebloPuerto RicanPuget Sound SalishRomanianRussianSalvadoranSamoanScandinavianScotch-IrishScottishSeminoleSenegaleseSerbianShoshoneSierra LeoneanSiouxSlavicSlovakSloveneSomaliSouth AfricanSouth AmericanSouth American IndianSoviet UnionSpaniardSpanishSpanish AmericanSpanish American IndianSri LankanSubsaharan AfricanSudaneseSwedishSwissSyrianTaiwaneseThaiTlingit-HaidaTohono O'OdhamTonganTrinidadian and TobagonianTsimshianTurkishU.S. Virgin IslanderUgandanUkrainianUruguayanUteVenezuelanVietnameseWelshWest IndianYakamaYaquiYugoslavianYumanYup'ikZimbabwean
Immigration
NonimmigrantsImmigrantsAfghanistanAfricaAlbaniaArgentinaArmeniaAsiaAustraliaAustriaBahamasBangladeshBarbadosBelarusBelgiumBelizeBoliviaBosnia and HerzegovinaBrazilBulgariaBurma/MyanmarCabo VerdeCambodiaCameroonCanadaCaribbeanCentral AmericaChileChinaColombiaCongoCosta RicaCroatiaCubaCzechoslovakiaDenmarkDominicaDominican RepublicEastern AfricaEastern AsiaEastern EuropeEcuadorEgyptEl SalvadorEnglandEritreaEthiopiaEuropeFijiFranceGermanyGhanaGreeceGrenadaGuatemalaGuyanaHaitiHondurasHong KongHungaryIndiaIndonesiaIranIraqIrelandIsraelItalyJamaicaJapanJordanKazakhstanKenyaKoreaKuwaitLaosLatin AmericaLatviaLebanonLiberiaLithuaniaMalaysiaMexicoMicronesiaMiddle AfricaMoldovaMoroccoNepalNetherlandsNicaraguaNigeriaNorth AmericaNorth MacedoniaNorthern AfricaNorthern EuropeNorwayOceaniaPakistanPanamaPeruPhilippinesPolandPortugalRomaniaRussiaSaudi ArabiaScotlandSenegalSerbiaSierra LeoneSingaporeSomaliaSouth AfricaSouth AmericaSouth Central AsiaSouth Eastern AsiaSouthern EuropeSpainSri LankaSt. Vincent and the GrenadinesSudanSwedenSwitzerlandSyriaTaiwanThailandTrinidad and TobagoTurkeyUgandaUkraineUruguayUzbekistanVenezuelaVietnamWest IndiesWestern AfricaWestern AsiaWestern EuropeYemenZaireZimbabwe
4th Grade
Income
Poverty
Unemployment
Labor Participation
Family Structure
Vehicle Availability
Education Level
Disability

4th Grade Comparison

Immigrants from the Azores

Nonimmigrants

Tragic
Exceptional
96.1%
4TH GRADE
0.0/ 100
METRIC RATING
318th/ 347
METRIC RANK
97.9%
4TH GRADE
97.5/ 100
METRIC RATING
104th/ 347
METRIC RANK

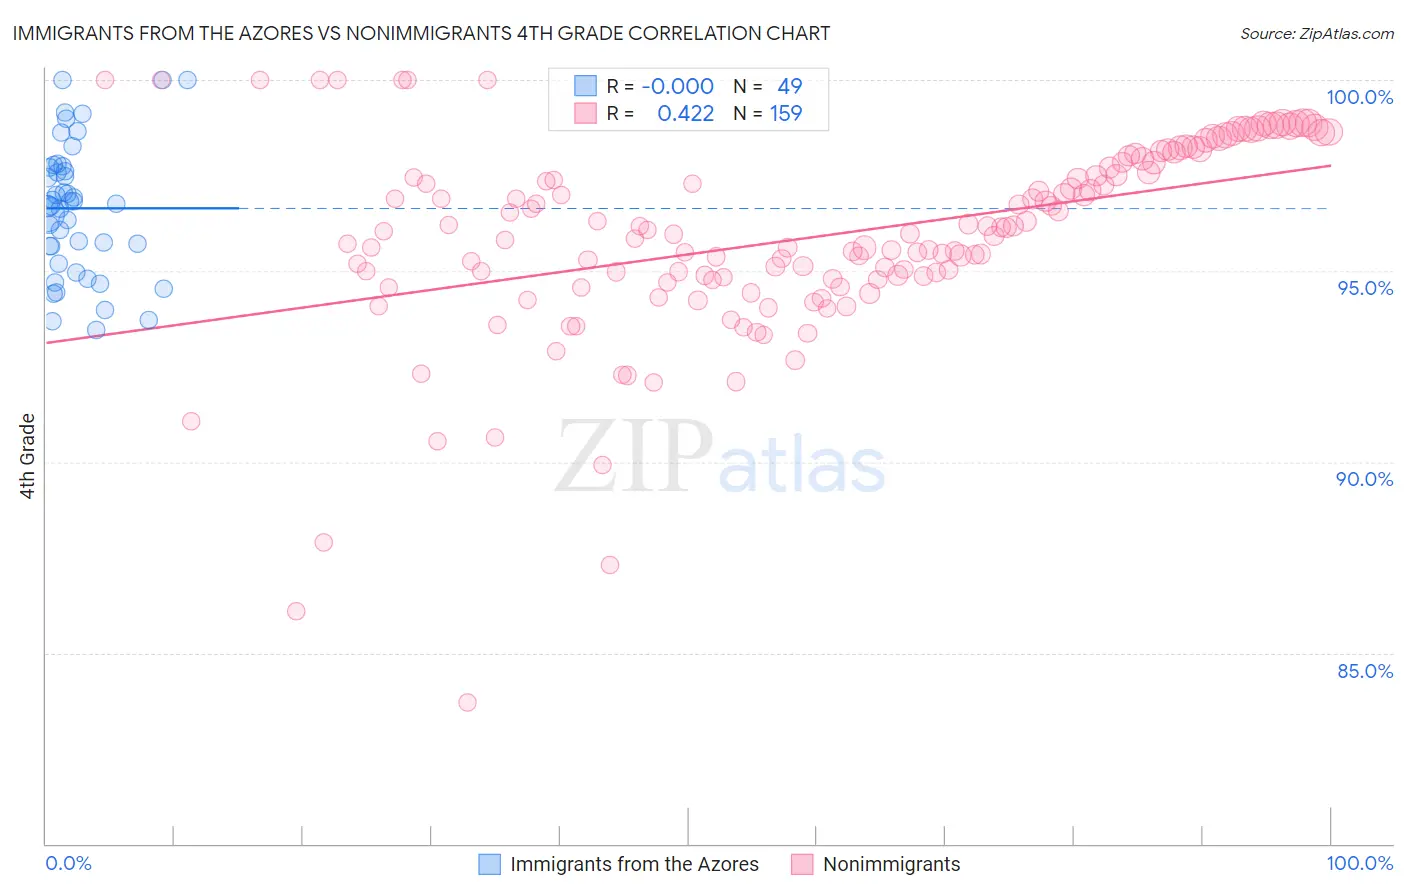
Immigrants from the Azores vs Nonimmigrants 4th Grade Correlation Chart

The statistical analysis conducted on geographies consisting of 46,257,310 people shows no correlation between the proportion of Immigrants from the Azores and percentage of population with at least 4th grade education in the United States with a correlation coefficient (R) of -0.000 and weighted average of 96.1%. Similarly, the statistical analysis conducted on geographies consisting of 585,374,642 people shows a moderate positive correlation between the proportion of Nonimmigrants and percentage of population with at least 4th grade education in the United States with a correlation coefficient (R) of 0.422 and weighted average of 97.9%, a difference of 1.8%.
Immigrants from the Azores vs Nonimmigrants 4th Grade

4th Grade Correlation Summary

MeasurementImmigrants from the AzoresNonimmigrants
Minimum93.4%83.7%
Maximum100.0%100.0%
Range6.6%16.3%
Mean96.6%95.9%
Median96.8%96.0%
Interquartile 25% (IQ1)95.4%94.8%
Interquartile 75% (IQ3)97.7%97.8%
Interquartile Range (IQR)2.3%3.1%
Standard Deviation (Sample)1.7%2.6%
Standard Deviation (Population)1.7%2.6%

Similar Demographics by 4th Grade

Demographics Similar to Immigrants from the Azores by 4th Grade

In terms of 4th grade, the demographic groups most similar to Immigrants from the Azores are Belizean (96.1%, a difference of 0.020%), Central American Indian (96.2%, a difference of 0.040%), Bangladeshi (96.1%, a difference of 0.040%), Immigrants from Ecuador (96.2%, a difference of 0.080%), and Vietnamese (96.2%, a difference of 0.090%).
DemographicsRating | Rank4th Grade
Immigrants | Bangladesh
0.0
/100
|
#311
Tragic
96.2%
Cape Verdeans
0.0
/100
|
#312
Tragic
96.2%
Indonesians
0.0
/100
|
#313
Tragic
96.2%
Vietnamese
0.0
/100
|
#314
Tragic
96.2%
Nicaraguans
0.0
/100
|
#315
Tragic
96.2%
Immigrants | Ecuador
0.0
/100
|
#316
Tragic
96.2%
Central American Indians
0.0
/100
|
#317
Tragic
96.2%
Immigrants | Azores
0.0
/100
|
#318
Tragic
96.1%
Belizeans
0.0
/100
|
#319
Tragic
96.1%
Bangladeshis
0.0
/100
|
#320
Tragic
96.1%
Japanese
0.0
/100
|
#321
Tragic
96.0%
Immigrants | Vietnam
0.0
/100
|
#322
Tragic
96.0%
Immigrants | Nicaragua
0.0
/100
|
#323
Tragic
96.0%
Immigrants | Belize
0.0
/100
|
#324
Tragic
96.0%
Dominicans
0.0
/100
|
#325
Tragic
96.0%

Demographics Similar to Nonimmigrants by 4th Grade

In terms of 4th grade, the demographic groups most similar to Nonimmigrants are German Russian (97.9%, a difference of 0.0%), Immigrants from Czechoslovakia (97.9%, a difference of 0.0%), Puget Sound Salish (97.9%, a difference of 0.010%), Bhutanese (97.9%, a difference of 0.010%), and Immigrants from Singapore (97.9%, a difference of 0.010%).
DemographicsRating | Rank4th Grade
Cheyenne
98.4
/100
|
#97
Exceptional
97.9%
South Africans
98.2
/100
|
#98
Exceptional
97.9%
Turks
98.2
/100
|
#99
Exceptional
97.9%
Yugoslavians
98.1
/100
|
#100
Exceptional
97.9%
Cree
98.1
/100
|
#101
Exceptional
97.9%
Choctaw
97.9
/100
|
#102
Exceptional
97.9%
Puget Sound Salish
97.7
/100
|
#103
Exceptional
97.9%
Immigrants | Nonimmigrants
97.5
/100
|
#104
Exceptional
97.9%
German Russians
97.5
/100
|
#105
Exceptional
97.9%
Immigrants | Czechoslovakia
97.5
/100
|
#106
Exceptional
97.9%
Bhutanese
97.4
/100
|
#107
Exceptional
97.9%
Immigrants | Singapore
97.3
/100
|
#108
Exceptional
97.9%
Immigrants | Latvia
96.8
/100
|
#109
Exceptional
97.8%
Thais
96.7
/100
|
#110
Exceptional
97.8%
Immigrants | Switzerland
96.1
/100
|
#111
Exceptional
97.8%