Immigrants from the Azores vs Immigrants from Eritrea 3rd Grade
COMPARE
Immigrants from the Azores
Immigrants from Eritrea
3rd Grade
3rd Grade Comparison
Immigrants from the Azores
Immigrants from Eritrea
96.6%
3RD GRADE
0.0/ 100
METRIC RATING
315th/ 347
METRIC RANK
97.0%
3RD GRADE
0.0/ 100
METRIC RATING
295th/ 347
METRIC RANK
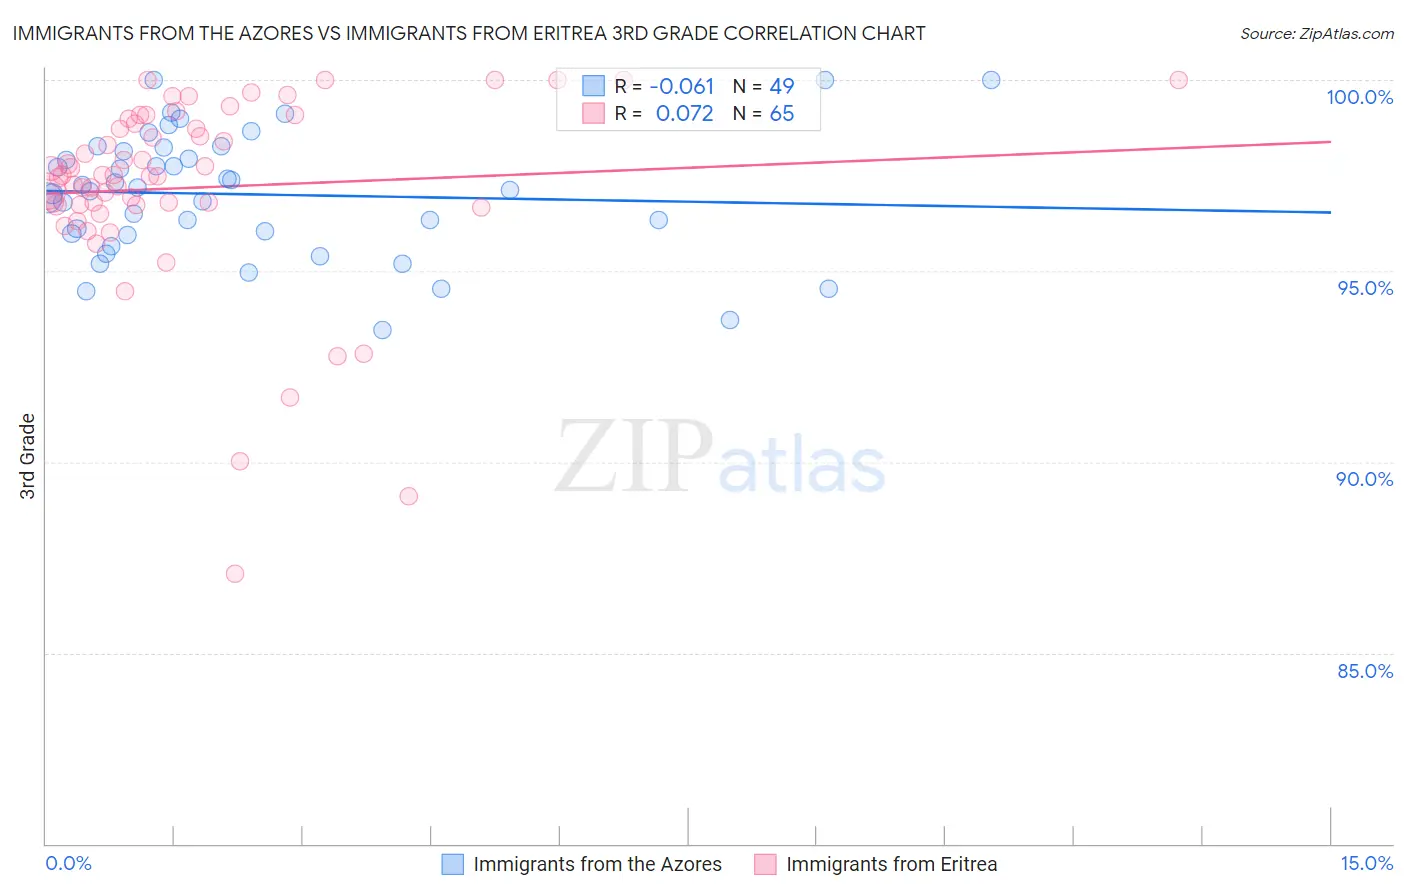
Immigrants from the Azores vs Immigrants from Eritrea 3rd Grade Correlation Chart
The statistical analysis conducted on geographies consisting of 46,257,310 people shows a slight negative correlation between the proportion of Immigrants from the Azores and percentage of population with at least 3rd grade education in the United States with a correlation coefficient (R) of -0.061 and weighted average of 96.6%. Similarly, the statistical analysis conducted on geographies consisting of 104,801,381 people shows a slight positive correlation between the proportion of Immigrants from Eritrea and percentage of population with at least 3rd grade education in the United States with a correlation coefficient (R) of 0.072 and weighted average of 97.0%, a difference of 0.42%.
3rd Grade Correlation Summary
| Measurement | Immigrants from the Azores | Immigrants from Eritrea |
| Minimum | 93.4% | 87.1% |
| Maximum | 100.0% | 100.0% |
| Range | 6.6% | 12.9% |
| Mean | 97.0% | 97.2% |
| Median | 97.1% | 97.5% |
| Interquartile 25% (IQ1) | 96.0% | 96.7% |
| Interquartile 75% (IQ3) | 98.2% | 98.9% |
| Interquartile Range (IQR) | 2.2% | 2.2% |
| Standard Deviation (Sample) | 1.6% | 2.6% |
| Standard Deviation (Population) | 1.6% | 2.5% |
Demographics Similar to Immigrants from the Azores and Immigrants from Eritrea by 3rd Grade
In terms of 3rd grade, the demographic groups most similar to Immigrants from the Azores are Immigrants from Ecuador (96.6%, a difference of 0.010%), Belizean (96.6%, a difference of 0.010%), Immigrants from Laos (96.6%, a difference of 0.020%), Immigrants from Guyana (96.6%, a difference of 0.040%), and Cape Verdean (96.6%, a difference of 0.070%). Similarly, the demographic groups most similar to Immigrants from Eritrea are Immigrants (96.9%, a difference of 0.11%), Haitian (96.9%, a difference of 0.13%), Immigrants from Dominica (96.9%, a difference of 0.13%), Somali (96.8%, a difference of 0.15%), and Immigrants from South Eastern Asia (96.8%, a difference of 0.15%).
| Demographics | Rating | Rank | 3rd Grade |
| Immigrants | Eritrea | 0.0 /100 | #295 | Tragic 97.0% |
| Immigrants | Immigrants | 0.0 /100 | #296 | Tragic 96.9% |
| Haitians | 0.0 /100 | #297 | Tragic 96.9% |
| Immigrants | Dominica | 0.0 /100 | #298 | Tragic 96.9% |
| Somalis | 0.0 /100 | #299 | Tragic 96.8% |
| Immigrants | South Eastern Asia | 0.0 /100 | #300 | Tragic 96.8% |
| Immigrants | Cuba | 0.0 /100 | #301 | Tragic 96.8% |
| Immigrants | Somalia | 0.0 /100 | #302 | Tragic 96.8% |
| Ecuadorians | 0.0 /100 | #303 | Tragic 96.7% |
| Immigrants | Caribbean | 0.0 /100 | #304 | Tragic 96.7% |
| Central American Indians | 0.0 /100 | #305 | Tragic 96.7% |
| Guyanese | 0.0 /100 | #306 | Tragic 96.7% |
| Nicaraguans | 0.0 /100 | #307 | Tragic 96.7% |
| Immigrants | Haiti | 0.0 /100 | #308 | Tragic 96.7% |
| Sri Lankans | 0.0 /100 | #309 | Tragic 96.7% |
| Cape Verdeans | 0.0 /100 | #310 | Tragic 96.6% |
| Immigrants | Guyana | 0.0 /100 | #311 | Tragic 96.6% |
| Immigrants | Laos | 0.0 /100 | #312 | Tragic 96.6% |
| Immigrants | Ecuador | 0.0 /100 | #313 | Tragic 96.6% |
| Belizeans | 0.0 /100 | #314 | Tragic 96.6% |
| Immigrants | Azores | 0.0 /100 | #315 | Tragic 96.6% |