Immigrants from Australia vs Scotch-Irish Bachelor's Degree
COMPARE
Immigrants from Australia
Scotch-Irish
Bachelor's Degree
Bachelor's Degree Comparison
Immigrants from Australia
Scotch-Irish
48.5%
BACHELOR'S DEGREE
100.0/ 100
METRIC RATING
11th/ 347
METRIC RANK
36.4%
BACHELOR'S DEGREE
18.3/ 100
METRIC RATING
211th/ 347
METRIC RANK
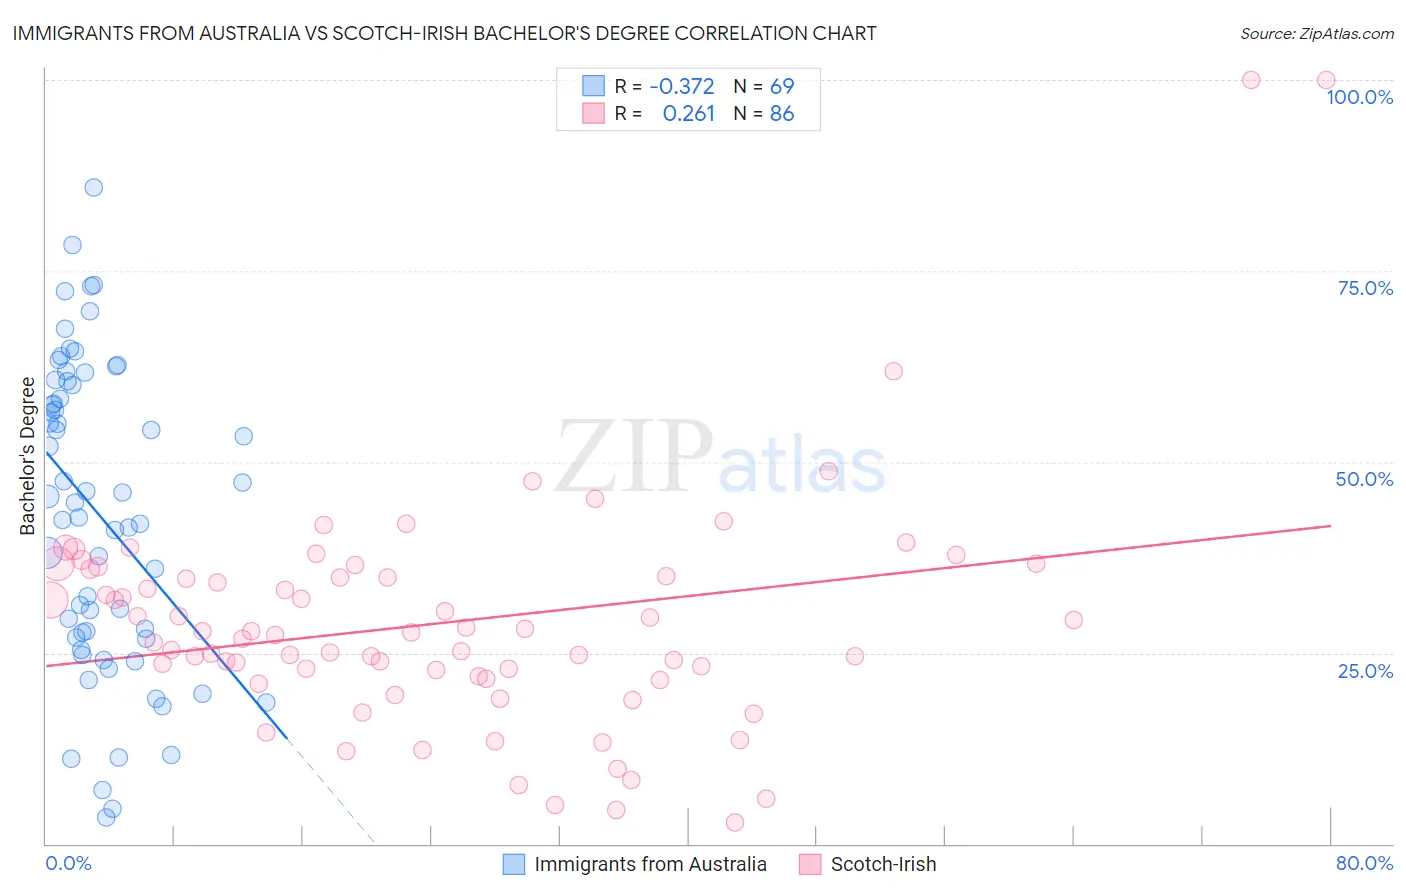
Immigrants from Australia vs Scotch-Irish Bachelor's Degree Correlation Chart
The statistical analysis conducted on geographies consisting of 227,197,750 people shows a mild negative correlation between the proportion of Immigrants from Australia and percentage of population with at least bachelor's degree education in the United States with a correlation coefficient (R) of -0.372 and weighted average of 48.5%. Similarly, the statistical analysis conducted on geographies consisting of 548,685,901 people shows a weak positive correlation between the proportion of Scotch-Irish and percentage of population with at least bachelor's degree education in the United States with a correlation coefficient (R) of 0.261 and weighted average of 36.4%, a difference of 33.1%.
Bachelor's Degree Correlation Summary
| Measurement | Immigrants from Australia | Scotch-Irish |
| Minimum | 3.4% | 2.9% |
| Maximum | 85.9% | 100.0% |
| Range | 82.5% | 97.1% |
| Mean | 43.1% | 28.9% |
| Median | 44.7% | 27.5% |
| Interquartile 25% (IQ1) | 27.0% | 21.9% |
| Interquartile 75% (IQ3) | 60.3% | 35.1% |
| Interquartile Range (IQR) | 33.3% | 13.2% |
| Standard Deviation (Sample) | 19.9% | 15.4% |
| Standard Deviation (Population) | 19.8% | 15.3% |
Similar Demographics by Bachelor's Degree
Demographics Similar to Immigrants from Australia by Bachelor's Degree
In terms of bachelor's degree, the demographic groups most similar to Immigrants from Australia are Immigrants from China (48.4%, a difference of 0.18%), Immigrants from South Central Asia (48.3%, a difference of 0.32%), Immigrants from Hong Kong (48.2%, a difference of 0.60%), Immigrants from Eastern Asia (48.1%, a difference of 0.74%), and Cypriot (49.0%, a difference of 1.1%).
| Demographics | Rating | Rank | Bachelor's Degree |
| Immigrants | Taiwan | 100.0 /100 | #4 | Exceptional 51.2% |
| Iranians | 100.0 /100 | #5 | Exceptional 51.0% |
| Okinawans | 100.0 /100 | #6 | Exceptional 50.5% |
| Immigrants | Iran | 100.0 /100 | #7 | Exceptional 50.3% |
| Thais | 100.0 /100 | #8 | Exceptional 50.1% |
| Immigrants | Israel | 100.0 /100 | #9 | Exceptional 50.0% |
| Cypriots | 100.0 /100 | #10 | Exceptional 49.0% |
| Immigrants | Australia | 100.0 /100 | #11 | Exceptional 48.5% |
| Immigrants | China | 100.0 /100 | #12 | Exceptional 48.4% |
| Immigrants | South Central Asia | 100.0 /100 | #13 | Exceptional 48.3% |
| Immigrants | Hong Kong | 100.0 /100 | #14 | Exceptional 48.2% |
| Immigrants | Eastern Asia | 100.0 /100 | #15 | Exceptional 48.1% |
| Soviet Union | 100.0 /100 | #16 | Exceptional 47.9% |
| Eastern Europeans | 100.0 /100 | #17 | Exceptional 47.5% |
| Indians (Asian) | 100.0 /100 | #18 | Exceptional 47.4% |
Demographics Similar to Scotch-Irish by Bachelor's Degree
In terms of bachelor's degree, the demographic groups most similar to Scotch-Irish are French (36.5%, a difference of 0.050%), Panamanian (36.5%, a difference of 0.080%), Immigrants from Philippines (36.4%, a difference of 0.080%), Immigrants from Thailand (36.5%, a difference of 0.18%), and Immigrants from Middle Africa (36.6%, a difference of 0.38%).
| Demographics | Rating | Rank | Bachelor's Degree |
| Immigrants | Immigrants | 22.8 /100 | #204 | Fair 36.7% |
| Finns | 22.2 /100 | #205 | Fair 36.7% |
| Spaniards | 21.2 /100 | #206 | Fair 36.6% |
| Immigrants | Middle Africa | 20.6 /100 | #207 | Fair 36.6% |
| Immigrants | Thailand | 19.4 /100 | #208 | Poor 36.5% |
| Panamanians | 18.8 /100 | #209 | Poor 36.5% |
| French | 18.6 /100 | #210 | Poor 36.5% |
| Scotch-Irish | 18.3 /100 | #211 | Poor 36.4% |
| Immigrants | Philippines | 17.8 /100 | #212 | Poor 36.4% |
| Immigrants | Panama | 14.2 /100 | #213 | Poor 36.2% |
| Germans | 13.9 /100 | #214 | Poor 36.1% |
| Immigrants | Western Africa | 13.8 /100 | #215 | Poor 36.1% |
| Barbadians | 13.5 /100 | #216 | Poor 36.1% |
| German Russians | 10.2 /100 | #217 | Poor 35.8% |
| Sub-Saharan Africans | 9.8 /100 | #218 | Tragic 35.8% |