Immigrants from St. Vincent and the Grenadines vs Scotch-Irish Bachelor's Degree
COMPARE
Immigrants from St. Vincent and the Grenadines
Scotch-Irish
Bachelor's Degree
Bachelor's Degree Comparison
Immigrants from St. Vincent and the Grenadines
Scotch-Irish
35.0%
BACHELOR'S DEGREE
4.3/ 100
METRIC RATING
231st/ 347
METRIC RANK
36.4%
BACHELOR'S DEGREE
18.3/ 100
METRIC RATING
211th/ 347
METRIC RANK
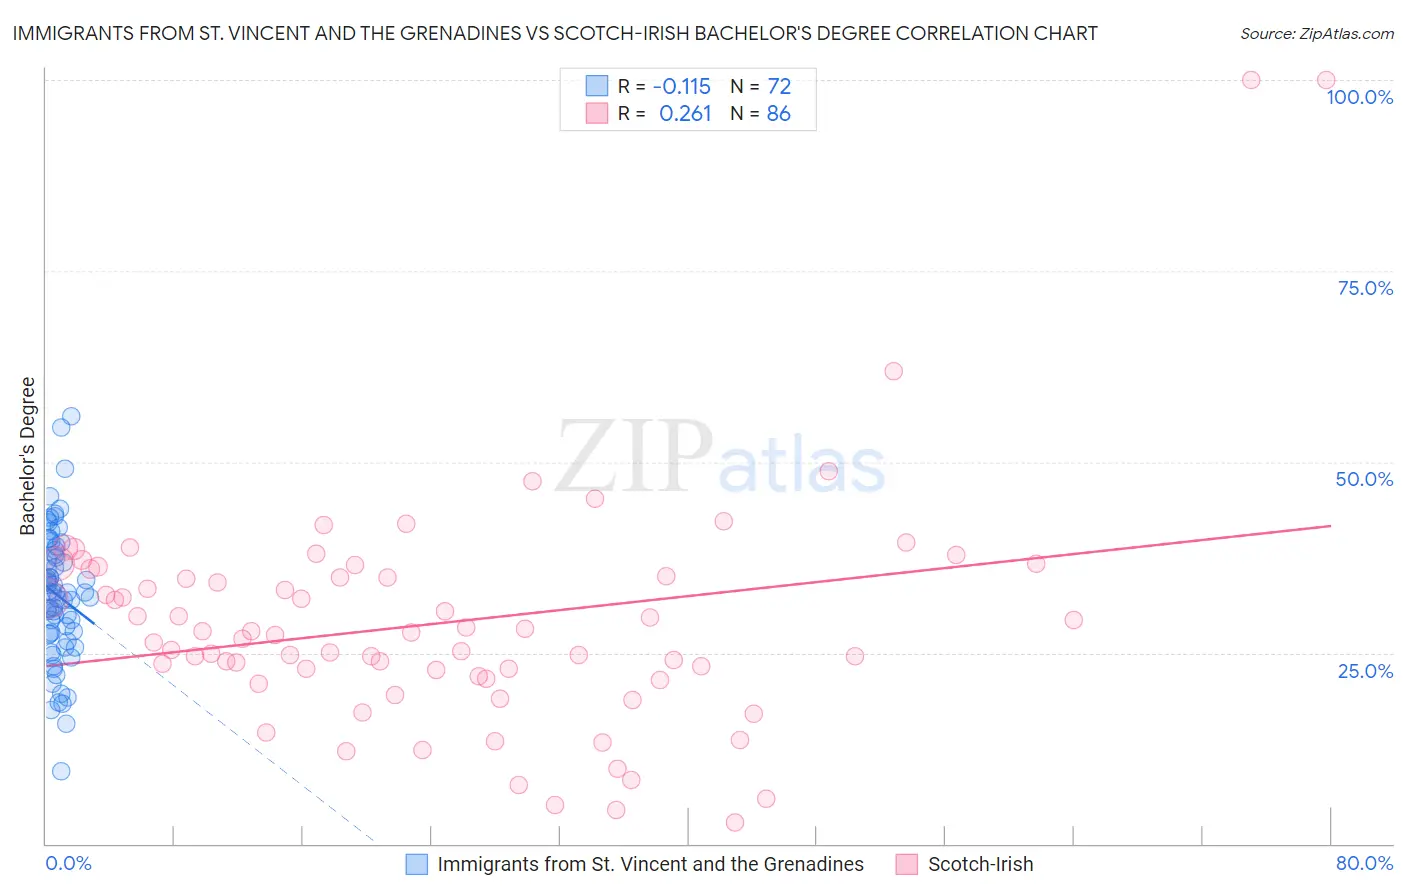
Immigrants from St. Vincent and the Grenadines vs Scotch-Irish Bachelor's Degree Correlation Chart
The statistical analysis conducted on geographies consisting of 56,189,778 people shows a poor negative correlation between the proportion of Immigrants from St. Vincent and the Grenadines and percentage of population with at least bachelor's degree education in the United States with a correlation coefficient (R) of -0.115 and weighted average of 35.0%. Similarly, the statistical analysis conducted on geographies consisting of 548,685,901 people shows a weak positive correlation between the proportion of Scotch-Irish and percentage of population with at least bachelor's degree education in the United States with a correlation coefficient (R) of 0.261 and weighted average of 36.4%, a difference of 4.2%.
Bachelor's Degree Correlation Summary
| Measurement | Immigrants from St. Vincent and the Grenadines | Scotch-Irish |
| Minimum | 9.4% | 2.9% |
| Maximum | 56.0% | 100.0% |
| Range | 46.6% | 97.1% |
| Mean | 32.5% | 28.9% |
| Median | 32.9% | 27.5% |
| Interquartile 25% (IQ1) | 27.4% | 21.9% |
| Interquartile 75% (IQ3) | 38.2% | 35.1% |
| Interquartile Range (IQR) | 10.7% | 13.2% |
| Standard Deviation (Sample) | 8.7% | 15.4% |
| Standard Deviation (Population) | 8.7% | 15.3% |
Demographics Similar to Immigrants from St. Vincent and the Grenadines and Scotch-Irish by Bachelor's Degree
In terms of bachelor's degree, the demographic groups most similar to Immigrants from St. Vincent and the Grenadines are Immigrants from Grenada (35.0%, a difference of 0.020%), White/Caucasian (35.3%, a difference of 0.87%), Immigrants from Trinidad and Tobago (35.3%, a difference of 0.95%), Ecuadorian (35.4%, a difference of 1.2%), and Portuguese (35.5%, a difference of 1.4%). Similarly, the demographic groups most similar to Scotch-Irish are Immigrants from Philippines (36.4%, a difference of 0.080%), Immigrants from Panama (36.2%, a difference of 0.76%), German (36.1%, a difference of 0.83%), Immigrants from Western Africa (36.1%, a difference of 0.86%), and Barbadian (36.1%, a difference of 0.92%).
| Demographics | Rating | Rank | Bachelor's Degree |
| Scotch-Irish | 18.3 /100 | #211 | Poor 36.4% |
| Immigrants | Philippines | 17.8 /100 | #212 | Poor 36.4% |
| Immigrants | Panama | 14.2 /100 | #213 | Poor 36.2% |
| Germans | 13.9 /100 | #214 | Poor 36.1% |
| Immigrants | Western Africa | 13.8 /100 | #215 | Poor 36.1% |
| Barbadians | 13.5 /100 | #216 | Poor 36.1% |
| German Russians | 10.2 /100 | #217 | Poor 35.8% |
| Sub-Saharan Africans | 9.8 /100 | #218 | Tragic 35.8% |
| West Indians | 9.7 /100 | #219 | Tragic 35.8% |
| Spanish | 9.6 /100 | #220 | Tragic 35.8% |
| Dutch | 9.2 /100 | #221 | Tragic 35.7% |
| Trinidadians and Tobagonians | 8.8 /100 | #222 | Tragic 35.7% |
| French Canadians | 8.3 /100 | #223 | Tragic 35.6% |
| Immigrants | Barbados | 7.5 /100 | #224 | Tragic 35.5% |
| Immigrants | Burma/Myanmar | 7.3 /100 | #225 | Tragic 35.5% |
| Portuguese | 7.2 /100 | #226 | Tragic 35.5% |
| Ecuadorians | 6.6 /100 | #227 | Tragic 35.4% |
| Immigrants | Trinidad and Tobago | 6.0 /100 | #228 | Tragic 35.3% |
| Whites/Caucasians | 5.9 /100 | #229 | Tragic 35.3% |
| Immigrants | Grenada | 4.3 /100 | #230 | Tragic 35.0% |
| Immigrants | St. Vincent and the Grenadines | 4.3 /100 | #231 | Tragic 35.0% |