Immigrants from Australia vs Immigrants from Eastern Europe Bachelor's Degree
COMPARE
Immigrants from Australia
Immigrants from Eastern Europe
Bachelor's Degree
Bachelor's Degree Comparison
Immigrants from Australia
Immigrants from Eastern Europe
48.5%
BACHELOR'S DEGREE
100.0/ 100
METRIC RATING
11th/ 347
METRIC RANK
42.5%
BACHELOR'S DEGREE
99.4/ 100
METRIC RATING
77th/ 347
METRIC RANK
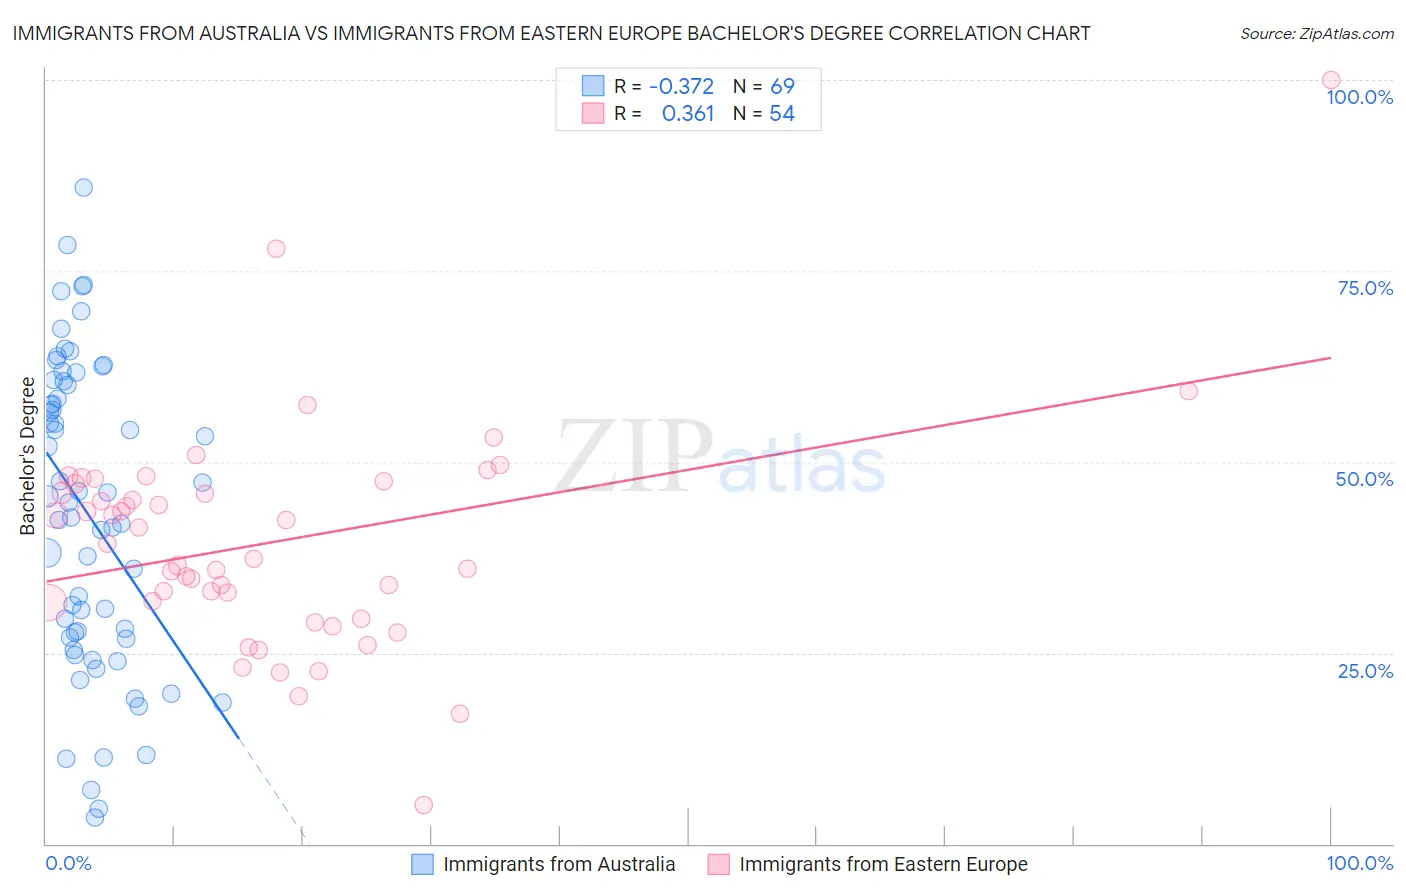
Immigrants from Australia vs Immigrants from Eastern Europe Bachelor's Degree Correlation Chart
The statistical analysis conducted on geographies consisting of 227,197,750 people shows a mild negative correlation between the proportion of Immigrants from Australia and percentage of population with at least bachelor's degree education in the United States with a correlation coefficient (R) of -0.372 and weighted average of 48.5%. Similarly, the statistical analysis conducted on geographies consisting of 475,819,217 people shows a mild positive correlation between the proportion of Immigrants from Eastern Europe and percentage of population with at least bachelor's degree education in the United States with a correlation coefficient (R) of 0.361 and weighted average of 42.5%, a difference of 14.1%.
Bachelor's Degree Correlation Summary
| Measurement | Immigrants from Australia | Immigrants from Eastern Europe |
| Minimum | 3.4% | 5.0% |
| Maximum | 85.9% | 100.0% |
| Range | 82.5% | 95.0% |
| Mean | 43.1% | 39.5% |
| Median | 44.7% | 38.3% |
| Interquartile 25% (IQ1) | 27.0% | 31.6% |
| Interquartile 75% (IQ3) | 60.3% | 47.1% |
| Interquartile Range (IQR) | 33.3% | 15.5% |
| Standard Deviation (Sample) | 19.9% | 14.7% |
| Standard Deviation (Population) | 19.8% | 14.5% |
Similar Demographics by Bachelor's Degree
Demographics Similar to Immigrants from Australia by Bachelor's Degree
In terms of bachelor's degree, the demographic groups most similar to Immigrants from Australia are Immigrants from China (48.4%, a difference of 0.18%), Immigrants from South Central Asia (48.3%, a difference of 0.32%), Immigrants from Hong Kong (48.2%, a difference of 0.60%), Immigrants from Eastern Asia (48.1%, a difference of 0.74%), and Cypriot (49.0%, a difference of 1.1%).
| Demographics | Rating | Rank | Bachelor's Degree |
| Immigrants | Taiwan | 100.0 /100 | #4 | Exceptional 51.2% |
| Iranians | 100.0 /100 | #5 | Exceptional 51.0% |
| Okinawans | 100.0 /100 | #6 | Exceptional 50.5% |
| Immigrants | Iran | 100.0 /100 | #7 | Exceptional 50.3% |
| Thais | 100.0 /100 | #8 | Exceptional 50.1% |
| Immigrants | Israel | 100.0 /100 | #9 | Exceptional 50.0% |
| Cypriots | 100.0 /100 | #10 | Exceptional 49.0% |
| Immigrants | Australia | 100.0 /100 | #11 | Exceptional 48.5% |
| Immigrants | China | 100.0 /100 | #12 | Exceptional 48.4% |
| Immigrants | South Central Asia | 100.0 /100 | #13 | Exceptional 48.3% |
| Immigrants | Hong Kong | 100.0 /100 | #14 | Exceptional 48.2% |
| Immigrants | Eastern Asia | 100.0 /100 | #15 | Exceptional 48.1% |
| Soviet Union | 100.0 /100 | #16 | Exceptional 47.9% |
| Eastern Europeans | 100.0 /100 | #17 | Exceptional 47.5% |
| Indians (Asian) | 100.0 /100 | #18 | Exceptional 47.4% |
Demographics Similar to Immigrants from Eastern Europe by Bachelor's Degree
In terms of bachelor's degree, the demographic groups most similar to Immigrants from Eastern Europe are Immigrants from Ethiopia (42.5%, a difference of 0.060%), Immigrants from Egypt (42.6%, a difference of 0.18%), Immigrants from Zimbabwe (42.6%, a difference of 0.20%), Immigrants from Lebanon (42.4%, a difference of 0.23%), and Bhutanese (42.7%, a difference of 0.41%).
| Demographics | Rating | Rank | Bachelor's Degree |
| Immigrants | Romania | 99.6 /100 | #70 | Exceptional 42.9% |
| Immigrants | Argentina | 99.6 /100 | #71 | Exceptional 42.8% |
| Ethiopians | 99.5 /100 | #72 | Exceptional 42.8% |
| Immigrants | Uzbekistan | 99.5 /100 | #73 | Exceptional 42.8% |
| Bhutanese | 99.5 /100 | #74 | Exceptional 42.7% |
| Immigrants | Zimbabwe | 99.4 /100 | #75 | Exceptional 42.6% |
| Immigrants | Egypt | 99.4 /100 | #76 | Exceptional 42.6% |
| Immigrants | Eastern Europe | 99.4 /100 | #77 | Exceptional 42.5% |
| Immigrants | Ethiopia | 99.4 /100 | #78 | Exceptional 42.5% |
| Immigrants | Lebanon | 99.3 /100 | #79 | Exceptional 42.4% |
| Immigrants | Croatia | 99.2 /100 | #80 | Exceptional 42.3% |
| Immigrants | Hungary | 99.2 /100 | #81 | Exceptional 42.3% |
| Immigrants | Scotland | 99.2 /100 | #82 | Exceptional 42.3% |
| Armenians | 99.2 /100 | #83 | Exceptional 42.3% |
| Immigrants | Western Asia | 99.2 /100 | #84 | Exceptional 42.3% |