Immigrants from Asia vs Kenyan 11th Grade
COMPARE
Immigrants from Asia
Kenyan
11th Grade
11th Grade Comparison
Immigrants from Asia
Kenyans
92.4%
11TH GRADE
37.4/ 100
METRIC RATING
184th/ 347
METRIC RANK
92.9%
11TH GRADE
82.0/ 100
METRIC RATING
142nd/ 347
METRIC RANK
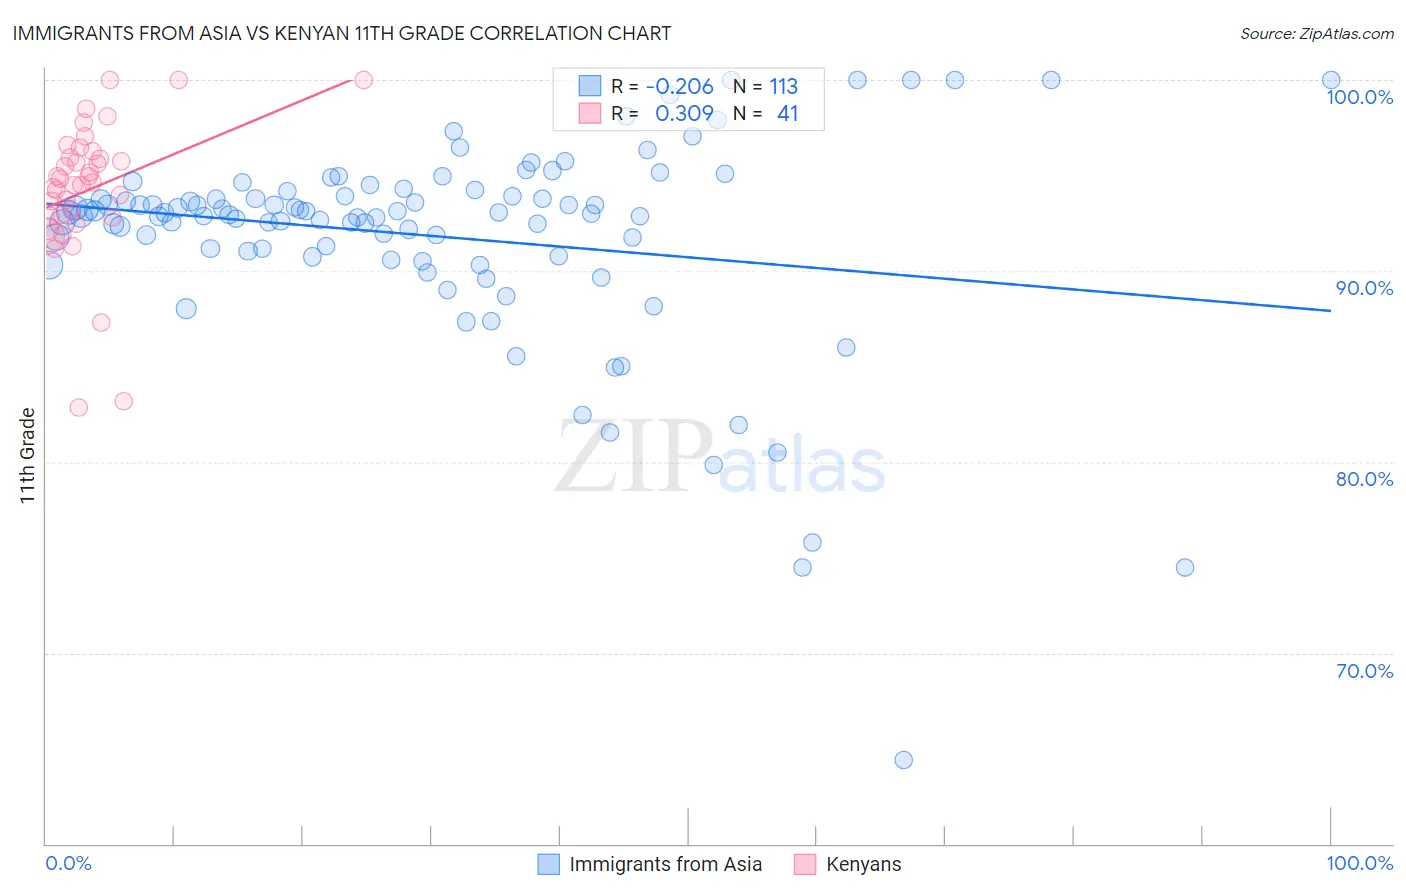
Immigrants from Asia vs Kenyan 11th Grade Correlation Chart
The statistical analysis conducted on geographies consisting of 549,170,438 people shows a weak negative correlation between the proportion of Immigrants from Asia and percentage of population with at least 11th grade education in the United States with a correlation coefficient (R) of -0.206 and weighted average of 92.4%. Similarly, the statistical analysis conducted on geographies consisting of 168,244,042 people shows a mild positive correlation between the proportion of Kenyans and percentage of population with at least 11th grade education in the United States with a correlation coefficient (R) of 0.309 and weighted average of 92.9%, a difference of 0.50%.
11th Grade Correlation Summary
| Measurement | Immigrants from Asia | Kenyan |
| Minimum | 64.4% | 82.9% |
| Maximum | 100.0% | 100.0% |
| Range | 35.6% | 17.1% |
| Mean | 91.8% | 94.3% |
| Median | 93.0% | 94.6% |
| Interquartile 25% (IQ1) | 90.9% | 92.8% |
| Interquartile 75% (IQ3) | 94.1% | 96.1% |
| Interquartile Range (IQR) | 3.1% | 3.3% |
| Standard Deviation (Sample) | 5.4% | 3.6% |
| Standard Deviation (Population) | 5.4% | 3.6% |
Similar Demographics by 11th Grade
Demographics Similar to Immigrants from Asia by 11th Grade
In terms of 11th grade, the demographic groups most similar to Immigrants from Asia are Immigrants from Malaysia (92.4%, a difference of 0.0%), Immigrants from Morocco (92.4%, a difference of 0.010%), Immigrants from Nepal (92.4%, a difference of 0.010%), Arapaho (92.4%, a difference of 0.020%), and Inupiat (92.4%, a difference of 0.030%).
| Demographics | Rating | Rank | 11th Grade |
| Guamanians/Chamorros | 45.0 /100 | #177 | Average 92.5% |
| Sudanese | 43.4 /100 | #178 | Average 92.5% |
| Creek | 40.9 /100 | #179 | Average 92.4% |
| Inupiat | 40.7 /100 | #180 | Average 92.4% |
| Cherokee | 40.7 /100 | #181 | Average 92.4% |
| Immigrants | Morocco | 38.6 /100 | #182 | Fair 92.4% |
| Immigrants | Malaysia | 37.6 /100 | #183 | Fair 92.4% |
| Immigrants | Asia | 37.4 /100 | #184 | Fair 92.4% |
| Immigrants | Nepal | 36.4 /100 | #185 | Fair 92.4% |
| Arapaho | 35.1 /100 | #186 | Fair 92.4% |
| Immigrants | Western Asia | 35.0 /100 | #187 | Fair 92.4% |
| Immigrants | Indonesia | 33.7 /100 | #188 | Fair 92.4% |
| Immigrants | Chile | 33.3 /100 | #189 | Fair 92.4% |
| Chickasaw | 31.4 /100 | #190 | Fair 92.3% |
| French American Indians | 30.8 /100 | #191 | Fair 92.3% |
Demographics Similar to Kenyans by 11th Grade
In terms of 11th grade, the demographic groups most similar to Kenyans are Ugandan (92.9%, a difference of 0.010%), Venezuelan (92.9%, a difference of 0.020%), Chilean (92.9%, a difference of 0.020%), Assyrian/Chaldean/Syriac (92.8%, a difference of 0.030%), and Crow (92.9%, a difference of 0.040%).
| Demographics | Rating | Rank | 11th Grade |
| Immigrants | Italy | 86.6 /100 | #135 | Excellent 92.9% |
| Cree | 85.9 /100 | #136 | Excellent 92.9% |
| Arabs | 85.4 /100 | #137 | Excellent 92.9% |
| Immigrants | Brazil | 85.1 /100 | #138 | Excellent 92.9% |
| Crow | 84.1 /100 | #139 | Excellent 92.9% |
| Venezuelans | 83.4 /100 | #140 | Excellent 92.9% |
| Chileans | 83.0 /100 | #141 | Excellent 92.9% |
| Kenyans | 82.0 /100 | #142 | Excellent 92.9% |
| Ugandans | 81.4 /100 | #143 | Excellent 92.9% |
| Assyrians/Chaldeans/Syriacs | 80.5 /100 | #144 | Excellent 92.8% |
| Pakistanis | 79.6 /100 | #145 | Good 92.8% |
| Iroquois | 79.1 /100 | #146 | Good 92.8% |
| Immigrants | Kenya | 78.7 /100 | #147 | Good 92.8% |
| Hmong | 78.6 /100 | #148 | Good 92.8% |
| Immigrants | Poland | 78.5 /100 | #149 | Good 92.8% |