Immigrants from Trinidad and Tobago vs Kenyan 11th Grade
COMPARE
Immigrants from Trinidad and Tobago
Kenyan
11th Grade
11th Grade Comparison
Immigrants from Trinidad and Tobago
Kenyans
90.9%
11TH GRADE
0.1/ 100
METRIC RATING
274th/ 347
METRIC RANK
92.9%
11TH GRADE
82.0/ 100
METRIC RATING
142nd/ 347
METRIC RANK
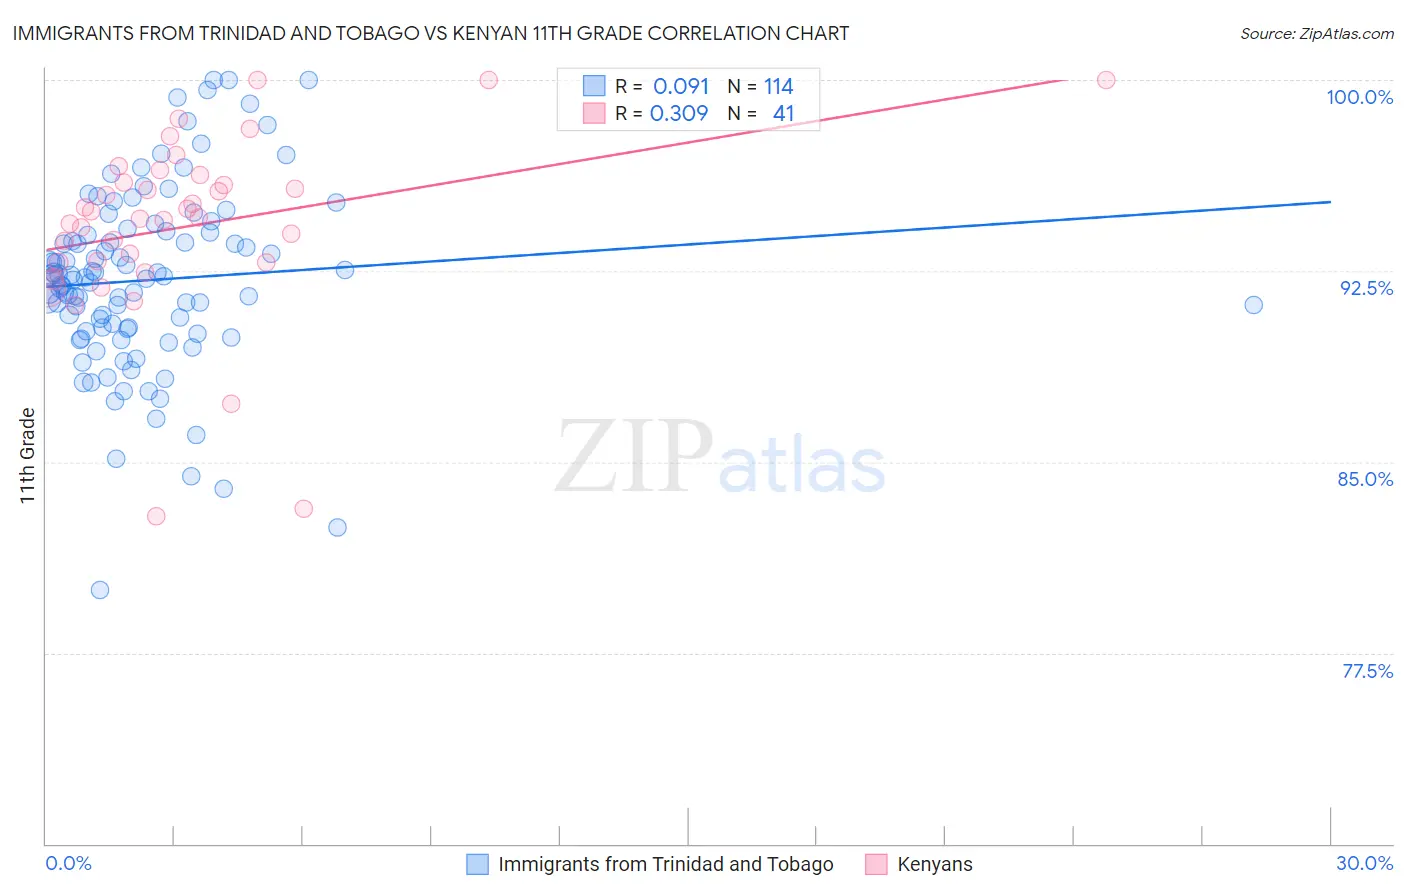
Immigrants from Trinidad and Tobago vs Kenyan 11th Grade Correlation Chart
The statistical analysis conducted on geographies consisting of 223,526,834 people shows a slight positive correlation between the proportion of Immigrants from Trinidad and Tobago and percentage of population with at least 11th grade education in the United States with a correlation coefficient (R) of 0.091 and weighted average of 90.9%. Similarly, the statistical analysis conducted on geographies consisting of 168,244,042 people shows a mild positive correlation between the proportion of Kenyans and percentage of population with at least 11th grade education in the United States with a correlation coefficient (R) of 0.309 and weighted average of 92.9%, a difference of 2.1%.
11th Grade Correlation Summary
| Measurement | Immigrants from Trinidad and Tobago | Kenyan |
| Minimum | 80.0% | 82.9% |
| Maximum | 100.0% | 100.0% |
| Range | 20.0% | 17.1% |
| Mean | 92.1% | 94.3% |
| Median | 92.2% | 94.6% |
| Interquartile 25% (IQ1) | 90.2% | 92.8% |
| Interquartile 75% (IQ3) | 94.0% | 96.1% |
| Interquartile Range (IQR) | 3.8% | 3.3% |
| Standard Deviation (Sample) | 3.6% | 3.6% |
| Standard Deviation (Population) | 3.6% | 3.6% |
Similar Demographics by 11th Grade
Demographics Similar to Immigrants from Trinidad and Tobago by 11th Grade
In terms of 11th grade, the demographic groups most similar to Immigrants from Trinidad and Tobago are Immigrants from South Eastern Asia (90.9%, a difference of 0.010%), Paiute (91.0%, a difference of 0.040%), Bangladeshi (90.9%, a difference of 0.080%), Immigrants from Peru (91.0%, a difference of 0.090%), and West Indian (91.0%, a difference of 0.090%).
| Demographics | Rating | Rank | 11th Grade |
| Immigrants | Jamaica | 0.3 /100 | #267 | Tragic 91.2% |
| U.S. Virgin Islanders | 0.2 /100 | #268 | Tragic 91.1% |
| Ute | 0.2 /100 | #269 | Tragic 91.1% |
| Trinidadians and Tobagonians | 0.2 /100 | #270 | Tragic 91.1% |
| Immigrants | Peru | 0.1 /100 | #271 | Tragic 91.0% |
| West Indians | 0.1 /100 | #272 | Tragic 91.0% |
| Paiute | 0.1 /100 | #273 | Tragic 91.0% |
| Immigrants | Trinidad and Tobago | 0.1 /100 | #274 | Tragic 90.9% |
| Immigrants | South Eastern Asia | 0.1 /100 | #275 | Tragic 90.9% |
| Bangladeshis | 0.1 /100 | #276 | Tragic 90.9% |
| Immigrants | Congo | 0.1 /100 | #277 | Tragic 90.9% |
| Malaysians | 0.1 /100 | #278 | Tragic 90.8% |
| Barbadians | 0.0 /100 | #279 | Tragic 90.8% |
| Sri Lankans | 0.0 /100 | #280 | Tragic 90.7% |
| Dutch West Indians | 0.0 /100 | #281 | Tragic 90.7% |
Demographics Similar to Kenyans by 11th Grade
In terms of 11th grade, the demographic groups most similar to Kenyans are Ugandan (92.9%, a difference of 0.010%), Venezuelan (92.9%, a difference of 0.020%), Chilean (92.9%, a difference of 0.020%), Assyrian/Chaldean/Syriac (92.8%, a difference of 0.030%), and Crow (92.9%, a difference of 0.040%).
| Demographics | Rating | Rank | 11th Grade |
| Immigrants | Italy | 86.6 /100 | #135 | Excellent 92.9% |
| Cree | 85.9 /100 | #136 | Excellent 92.9% |
| Arabs | 85.4 /100 | #137 | Excellent 92.9% |
| Immigrants | Brazil | 85.1 /100 | #138 | Excellent 92.9% |
| Crow | 84.1 /100 | #139 | Excellent 92.9% |
| Venezuelans | 83.4 /100 | #140 | Excellent 92.9% |
| Chileans | 83.0 /100 | #141 | Excellent 92.9% |
| Kenyans | 82.0 /100 | #142 | Excellent 92.9% |
| Ugandans | 81.4 /100 | #143 | Excellent 92.9% |
| Assyrians/Chaldeans/Syriacs | 80.5 /100 | #144 | Excellent 92.8% |
| Pakistanis | 79.6 /100 | #145 | Good 92.8% |
| Iroquois | 79.1 /100 | #146 | Good 92.8% |
| Immigrants | Kenya | 78.7 /100 | #147 | Good 92.8% |
| Hmong | 78.6 /100 | #148 | Good 92.8% |
| Immigrants | Poland | 78.5 /100 | #149 | Good 92.8% |