Immigrants from Asia vs Yugoslavian 11th Grade
COMPARE
Immigrants from Asia
Yugoslavian
11th Grade
11th Grade Comparison
Immigrants from Asia
Yugoslavians
92.4%
11TH GRADE
37.4/ 100
METRIC RATING
184th/ 347
METRIC RANK
93.4%
11TH GRADE
98.1/ 100
METRIC RATING
111th/ 347
METRIC RANK
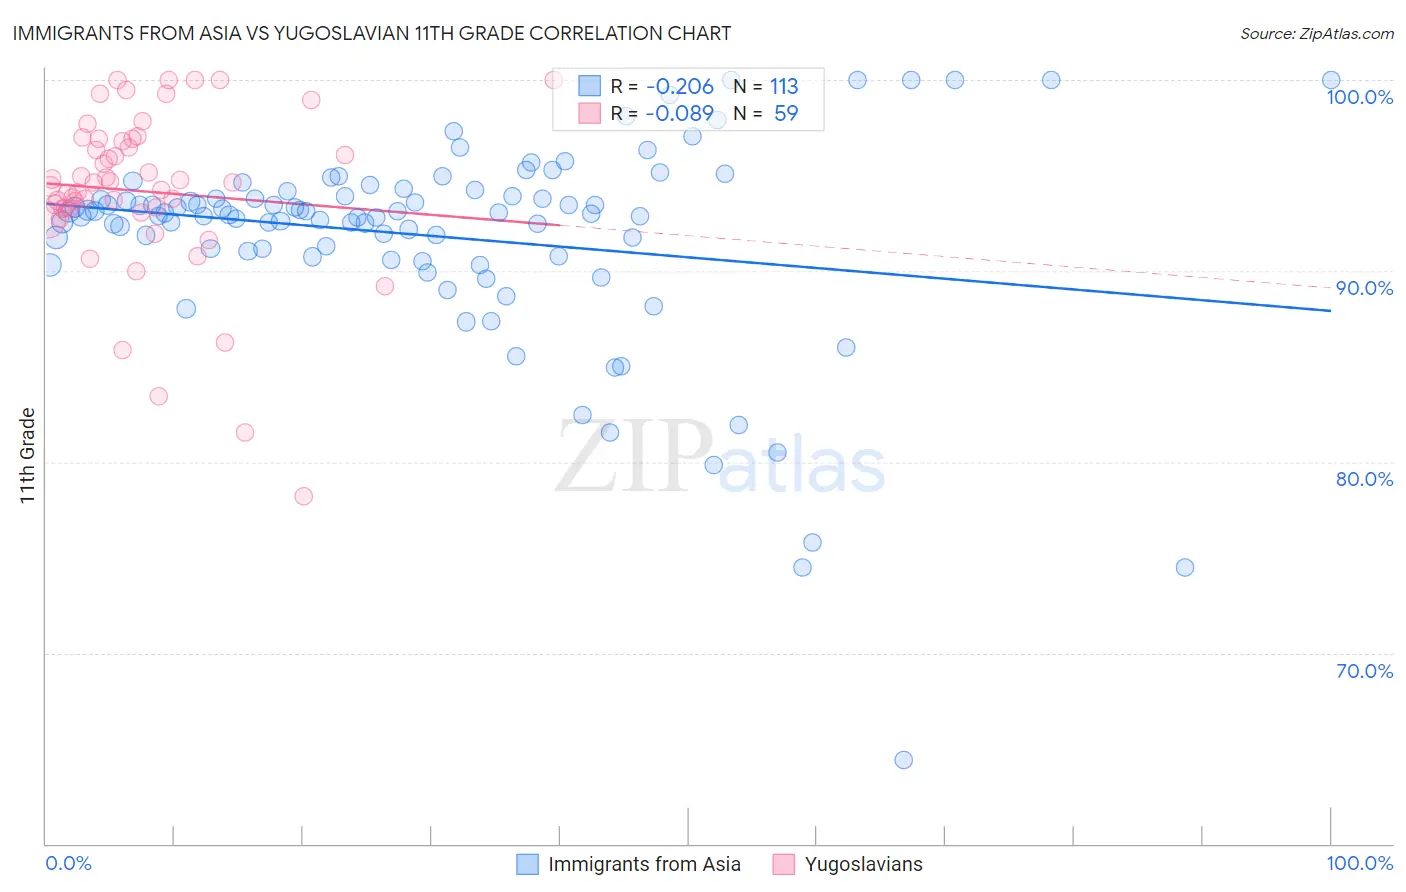
Immigrants from Asia vs Yugoslavian 11th Grade Correlation Chart
The statistical analysis conducted on geographies consisting of 549,170,438 people shows a weak negative correlation between the proportion of Immigrants from Asia and percentage of population with at least 11th grade education in the United States with a correlation coefficient (R) of -0.206 and weighted average of 92.4%. Similarly, the statistical analysis conducted on geographies consisting of 285,719,638 people shows a slight negative correlation between the proportion of Yugoslavians and percentage of population with at least 11th grade education in the United States with a correlation coefficient (R) of -0.089 and weighted average of 93.4%, a difference of 1.1%.
11th Grade Correlation Summary
| Measurement | Immigrants from Asia | Yugoslavian |
| Minimum | 64.4% | 78.2% |
| Maximum | 100.0% | 100.0% |
| Range | 35.6% | 21.8% |
| Mean | 91.8% | 94.2% |
| Median | 93.0% | 94.7% |
| Interquartile 25% (IQ1) | 90.9% | 93.3% |
| Interquartile 75% (IQ3) | 94.1% | 96.9% |
| Interquartile Range (IQR) | 3.1% | 3.7% |
| Standard Deviation (Sample) | 5.4% | 4.4% |
| Standard Deviation (Population) | 5.4% | 4.3% |
Similar Demographics by 11th Grade
Demographics Similar to Immigrants from Asia by 11th Grade
In terms of 11th grade, the demographic groups most similar to Immigrants from Asia are Immigrants from Malaysia (92.4%, a difference of 0.0%), Immigrants from Morocco (92.4%, a difference of 0.010%), Immigrants from Nepal (92.4%, a difference of 0.010%), Arapaho (92.4%, a difference of 0.020%), and Inupiat (92.4%, a difference of 0.030%).
| Demographics | Rating | Rank | 11th Grade |
| Guamanians/Chamorros | 45.0 /100 | #177 | Average 92.5% |
| Sudanese | 43.4 /100 | #178 | Average 92.5% |
| Creek | 40.9 /100 | #179 | Average 92.4% |
| Inupiat | 40.7 /100 | #180 | Average 92.4% |
| Cherokee | 40.7 /100 | #181 | Average 92.4% |
| Immigrants | Morocco | 38.6 /100 | #182 | Fair 92.4% |
| Immigrants | Malaysia | 37.6 /100 | #183 | Fair 92.4% |
| Immigrants | Asia | 37.4 /100 | #184 | Fair 92.4% |
| Immigrants | Nepal | 36.4 /100 | #185 | Fair 92.4% |
| Arapaho | 35.1 /100 | #186 | Fair 92.4% |
| Immigrants | Western Asia | 35.0 /100 | #187 | Fair 92.4% |
| Immigrants | Indonesia | 33.7 /100 | #188 | Fair 92.4% |
| Immigrants | Chile | 33.3 /100 | #189 | Fair 92.4% |
| Chickasaw | 31.4 /100 | #190 | Fair 92.3% |
| French American Indians | 30.8 /100 | #191 | Fair 92.3% |
Demographics Similar to Yugoslavians by 11th Grade
In terms of 11th grade, the demographic groups most similar to Yugoslavians are Immigrants from Germany (93.4%, a difference of 0.010%), Immigrants from Zimbabwe (93.4%, a difference of 0.030%), Syrian (93.4%, a difference of 0.040%), Jordanian (93.4%, a difference of 0.040%), and Immigrants from Norway (93.5%, a difference of 0.050%).
| Demographics | Rating | Rank | 11th Grade |
| Immigrants | Europe | 98.6 /100 | #104 | Exceptional 93.5% |
| Immigrants | Serbia | 98.6 /100 | #105 | Exceptional 93.5% |
| Immigrants | Croatia | 98.6 /100 | #106 | Exceptional 93.5% |
| Immigrants | Norway | 98.4 /100 | #107 | Exceptional 93.5% |
| Alaska Natives | 98.4 /100 | #108 | Exceptional 93.5% |
| Immigrants | Kuwait | 98.4 /100 | #109 | Exceptional 93.5% |
| Syrians | 98.4 /100 | #110 | Exceptional 93.4% |
| Yugoslavians | 98.1 /100 | #111 | Exceptional 93.4% |
| Immigrants | Germany | 98.0 /100 | #112 | Exceptional 93.4% |
| Immigrants | Zimbabwe | 97.8 /100 | #113 | Exceptional 93.4% |
| Jordanians | 97.8 /100 | #114 | Exceptional 93.4% |
| Palestinians | 97.7 /100 | #115 | Exceptional 93.4% |
| Immigrants | Hungary | 97.5 /100 | #116 | Exceptional 93.4% |
| Whites/Caucasians | 97.4 /100 | #117 | Exceptional 93.3% |
| Immigrants | Korea | 97.0 /100 | #118 | Exceptional 93.3% |