Immigrants from Africa vs Tlingit-Haida College, Under 1 year
COMPARE
Immigrants from Africa
Tlingit-Haida
College, Under 1 year
College, Under 1 year Comparison
Immigrants from Africa
Tlingit-Haida
65.3%
COLLEGE, UNDER 1 YEAR
44.7/ 100
METRIC RATING
182nd/ 347
METRIC RANK
65.9%
COLLEGE, UNDER 1 YEAR
66.4/ 100
METRIC RATING
159th/ 347
METRIC RANK
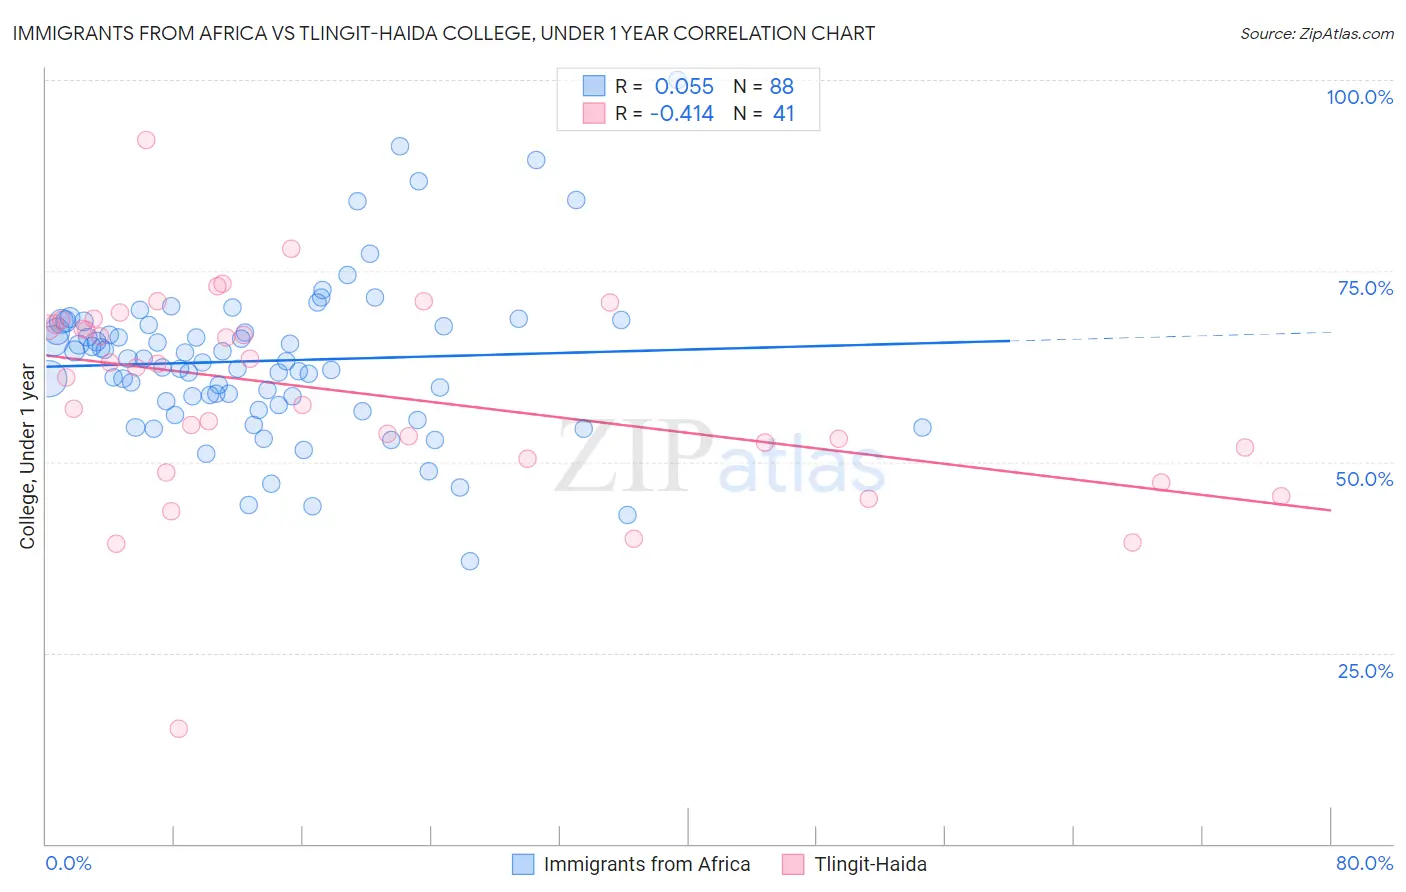
Immigrants from Africa vs Tlingit-Haida College, Under 1 year Correlation Chart
The statistical analysis conducted on geographies consisting of 469,444,786 people shows a slight positive correlation between the proportion of Immigrants from Africa and percentage of population with at least college, under 1 year education in the United States with a correlation coefficient (R) of 0.055 and weighted average of 65.3%. Similarly, the statistical analysis conducted on geographies consisting of 60,871,919 people shows a moderate negative correlation between the proportion of Tlingit-Haida and percentage of population with at least college, under 1 year education in the United States with a correlation coefficient (R) of -0.414 and weighted average of 65.9%, a difference of 0.99%.
College, Under 1 year Correlation Summary
| Measurement | Immigrants from Africa | Tlingit-Haida |
| Minimum | 37.0% | 15.0% |
| Maximum | 100.0% | 92.1% |
| Range | 63.0% | 77.1% |
| Mean | 63.2% | 59.1% |
| Median | 63.1% | 62.3% |
| Interquartile 25% (IQ1) | 57.7% | 51.2% |
| Interquartile 75% (IQ3) | 67.9% | 68.3% |
| Interquartile Range (IQR) | 10.2% | 17.2% |
| Standard Deviation (Sample) | 10.4% | 13.5% |
| Standard Deviation (Population) | 10.3% | 13.4% |
Similar Demographics by College, Under 1 year
Demographics Similar to Immigrants from Africa by College, Under 1 year
In terms of college, under 1 year, the demographic groups most similar to Immigrants from Africa are Spaniard (65.3%, a difference of 0.040%), Dutch (65.3%, a difference of 0.060%), Immigrants from Poland (65.2%, a difference of 0.10%), Bermudan (65.2%, a difference of 0.12%), and Sri Lankan (65.2%, a difference of 0.13%).
| Demographics | Rating | Rank | College, Under 1 year |
| Scotch-Irish | 49.5 /100 | #175 | Average 65.4% |
| French | 48.9 /100 | #176 | Average 65.4% |
| Immigrants | North Macedonia | 48.6 /100 | #177 | Average 65.4% |
| German Russians | 48.3 /100 | #178 | Average 65.4% |
| Guamanians/Chamorros | 48.2 /100 | #179 | Average 65.4% |
| Dutch | 46.1 /100 | #180 | Average 65.3% |
| Spaniards | 45.5 /100 | #181 | Average 65.3% |
| Immigrants | Africa | 44.7 /100 | #182 | Average 65.3% |
| Immigrants | Poland | 42.6 /100 | #183 | Average 65.2% |
| Bermudans | 42.0 /100 | #184 | Average 65.2% |
| Sri Lankans | 41.7 /100 | #185 | Average 65.2% |
| Immigrants | Sierra Leone | 39.7 /100 | #186 | Fair 65.1% |
| Immigrants | Southern Europe | 34.3 /100 | #187 | Fair 64.9% |
| Immigrants | Albania | 32.0 /100 | #188 | Fair 64.9% |
| Spanish | 31.6 /100 | #189 | Fair 64.9% |
Demographics Similar to Tlingit-Haida by College, Under 1 year
In terms of college, under 1 year, the demographic groups most similar to Tlingit-Haida are Albanian (65.9%, a difference of 0.010%), Brazilian (65.9%, a difference of 0.020%), Celtic (65.9%, a difference of 0.050%), Korean (65.9%, a difference of 0.050%), and Sierra Leonean (66.0%, a difference of 0.070%).
| Demographics | Rating | Rank | College, Under 1 year |
| Sudanese | 74.1 /100 | #152 | Good 66.2% |
| Belgians | 73.7 /100 | #153 | Good 66.2% |
| Immigrants | Eritrea | 71.9 /100 | #154 | Good 66.1% |
| Irish | 70.3 /100 | #155 | Good 66.0% |
| Welsh | 69.9 /100 | #156 | Good 66.0% |
| Sierra Leoneans | 67.8 /100 | #157 | Good 66.0% |
| Celtics | 67.3 /100 | #158 | Good 65.9% |
| Tlingit-Haida | 66.4 /100 | #159 | Good 65.9% |
| Albanians | 66.1 /100 | #160 | Good 65.9% |
| Brazilians | 66.0 /100 | #161 | Good 65.9% |
| Koreans | 65.3 /100 | #162 | Good 65.9% |
| Somalis | 62.7 /100 | #163 | Good 65.8% |
| Czechoslovakians | 62.6 /100 | #164 | Good 65.8% |
| Immigrants | Uzbekistan | 61.6 /100 | #165 | Good 65.8% |
| Moroccans | 56.7 /100 | #166 | Average 65.6% |