Immigrants from Africa vs Tlingit-Haida Hearing Disability
COMPARE
Immigrants from Africa
Tlingit-Haida
Hearing Disability
Hearing Disability Comparison
Immigrants from Africa
Tlingit-Haida
2.7%
HEARING DISABILITY
98.0/ 100
METRIC RATING
68th/ 347
METRIC RANK
4.8%
HEARING DISABILITY
0.0/ 100
METRIC RATING
344th/ 347
METRIC RANK
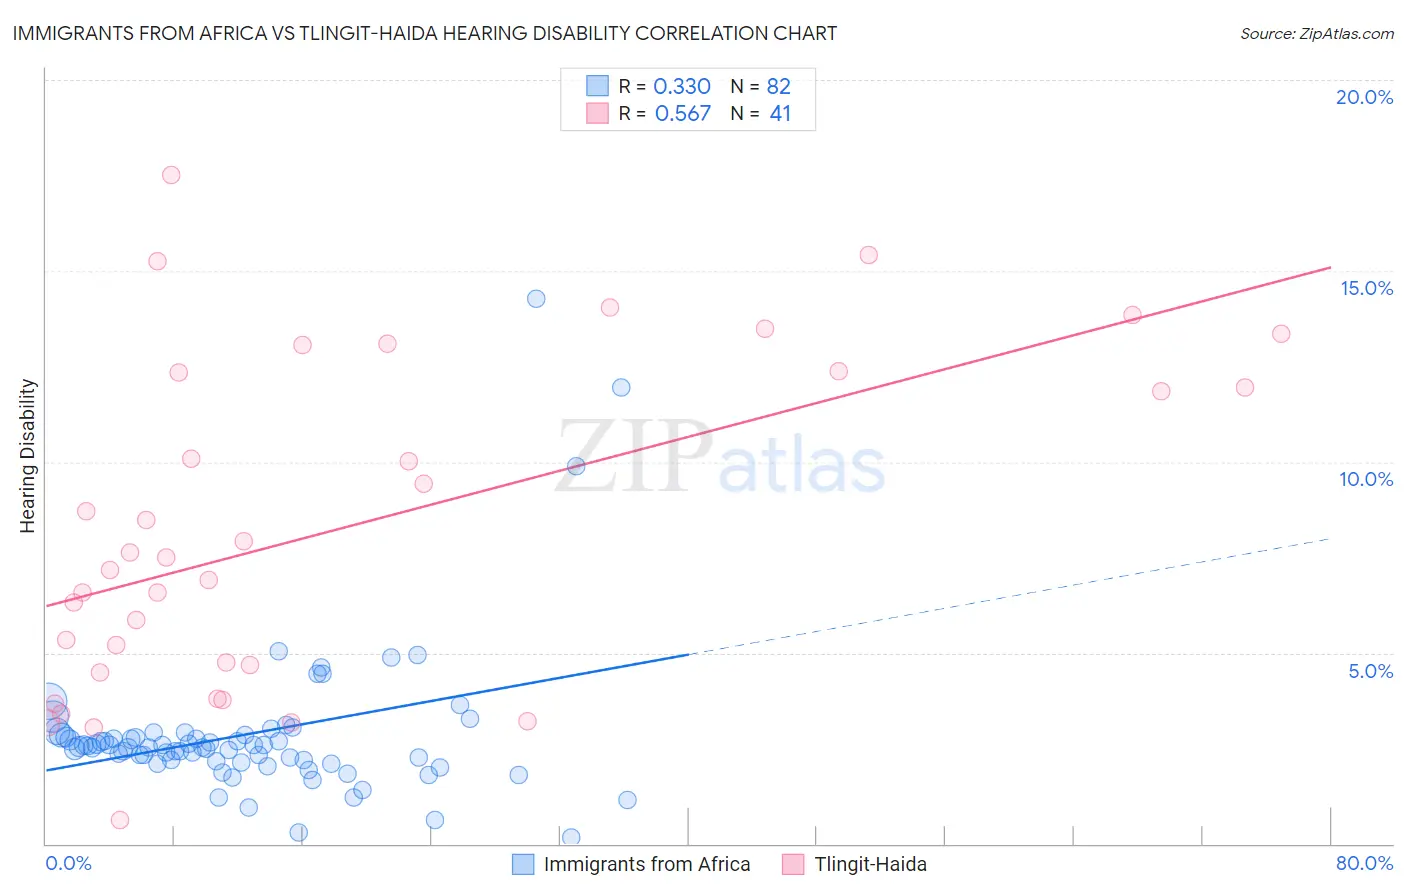
Immigrants from Africa vs Tlingit-Haida Hearing Disability Correlation Chart
The statistical analysis conducted on geographies consisting of 469,129,407 people shows a mild positive correlation between the proportion of Immigrants from Africa and percentage of population with hearing disability in the United States with a correlation coefficient (R) of 0.330 and weighted average of 2.7%. Similarly, the statistical analysis conducted on geographies consisting of 60,852,790 people shows a substantial positive correlation between the proportion of Tlingit-Haida and percentage of population with hearing disability in the United States with a correlation coefficient (R) of 0.567 and weighted average of 4.8%, a difference of 77.8%.
Hearing Disability Correlation Summary
| Measurement | Immigrants from Africa | Tlingit-Haida |
| Minimum | 0.17% | 0.61% |
| Maximum | 14.3% | 17.5% |
| Range | 14.1% | 16.9% |
| Mean | 2.9% | 8.3% |
| Median | 2.5% | 7.5% |
| Interquartile 25% (IQ1) | 2.2% | 4.6% |
| Interquartile 75% (IQ3) | 2.9% | 12.4% |
| Interquartile Range (IQR) | 0.70% | 7.8% |
| Standard Deviation (Sample) | 2.0% | 4.3% |
| Standard Deviation (Population) | 2.0% | 4.3% |
Similar Demographics by Hearing Disability
Demographics Similar to Immigrants from Africa by Hearing Disability
In terms of hearing disability, the demographic groups most similar to Immigrants from Africa are Nicaraguan (2.7%, a difference of 0.040%), Egyptian (2.7%, a difference of 0.13%), Peruvian (2.7%, a difference of 0.27%), Central American (2.7%, a difference of 0.32%), and Immigrants from Belize (2.7%, a difference of 0.36%).
| Demographics | Rating | Rank | Hearing Disability |
| Immigrants | Uzbekistan | 98.4 /100 | #61 | Exceptional 2.7% |
| Immigrants | Colombia | 98.4 /100 | #62 | Exceptional 2.7% |
| Indians (Asian) | 98.4 /100 | #63 | Exceptional 2.7% |
| Immigrants | Sri Lanka | 98.4 /100 | #64 | Exceptional 2.7% |
| Immigrants | Nepal | 98.3 /100 | #65 | Exceptional 2.7% |
| Immigrants | Belize | 98.2 /100 | #66 | Exceptional 2.7% |
| Egyptians | 98.1 /100 | #67 | Exceptional 2.7% |
| Immigrants | Africa | 98.0 /100 | #68 | Exceptional 2.7% |
| Nicaraguans | 97.9 /100 | #69 | Exceptional 2.7% |
| Peruvians | 97.7 /100 | #70 | Exceptional 2.7% |
| Central Americans | 97.7 /100 | #71 | Exceptional 2.7% |
| Afghans | 97.6 /100 | #72 | Exceptional 2.7% |
| Argentineans | 97.5 /100 | #73 | Exceptional 2.7% |
| Immigrants | Korea | 97.5 /100 | #74 | Exceptional 2.7% |
| Immigrants | Saudi Arabia | 97.5 /100 | #75 | Exceptional 2.7% |
Demographics Similar to Tlingit-Haida by Hearing Disability
In terms of hearing disability, the demographic groups most similar to Tlingit-Haida are Inupiat (4.7%, a difference of 2.7%), Tsimshian (4.7%, a difference of 2.9%), Navajo (4.6%, a difference of 4.5%), Pueblo (4.6%, a difference of 4.9%), and Choctaw (4.5%, a difference of 6.4%).
| Demographics | Rating | Rank | Hearing Disability |
| Dutch West Indians | 0.0 /100 | #333 | Tragic 4.3% |
| Aleuts | 0.0 /100 | #334 | Tragic 4.3% |
| Kiowa | 0.0 /100 | #335 | Tragic 4.3% |
| Creek | 0.0 /100 | #336 | Tragic 4.4% |
| Chickasaw | 0.0 /100 | #337 | Tragic 4.5% |
| Alaska Natives | 0.0 /100 | #338 | Tragic 4.5% |
| Choctaw | 0.0 /100 | #339 | Tragic 4.5% |
| Pueblo | 0.0 /100 | #340 | Tragic 4.6% |
| Navajo | 0.0 /100 | #341 | Tragic 4.6% |
| Tsimshian | 0.0 /100 | #342 | Tragic 4.7% |
| Inupiat | 0.0 /100 | #343 | Tragic 4.7% |
| Tlingit-Haida | 0.0 /100 | #344 | Tragic 4.8% |
| Alaskan Athabascans | 0.0 /100 | #345 | Tragic 5.3% |
| Colville | 0.0 /100 | #346 | Tragic 5.3% |
| Yup'ik | 0.0 /100 | #347 | Tragic 5.8% |