Hungarian vs Afghan Professional Degree
COMPARE
Hungarian
Afghan
Professional Degree
Professional Degree Comparison
Hungarians
Afghans
4.6%
PROFESSIONAL DEGREE
80.8/ 100
METRIC RATING
143rd/ 347
METRIC RANK
4.7%
PROFESSIONAL DEGREE
88.8/ 100
METRIC RATING
138th/ 347
METRIC RANK
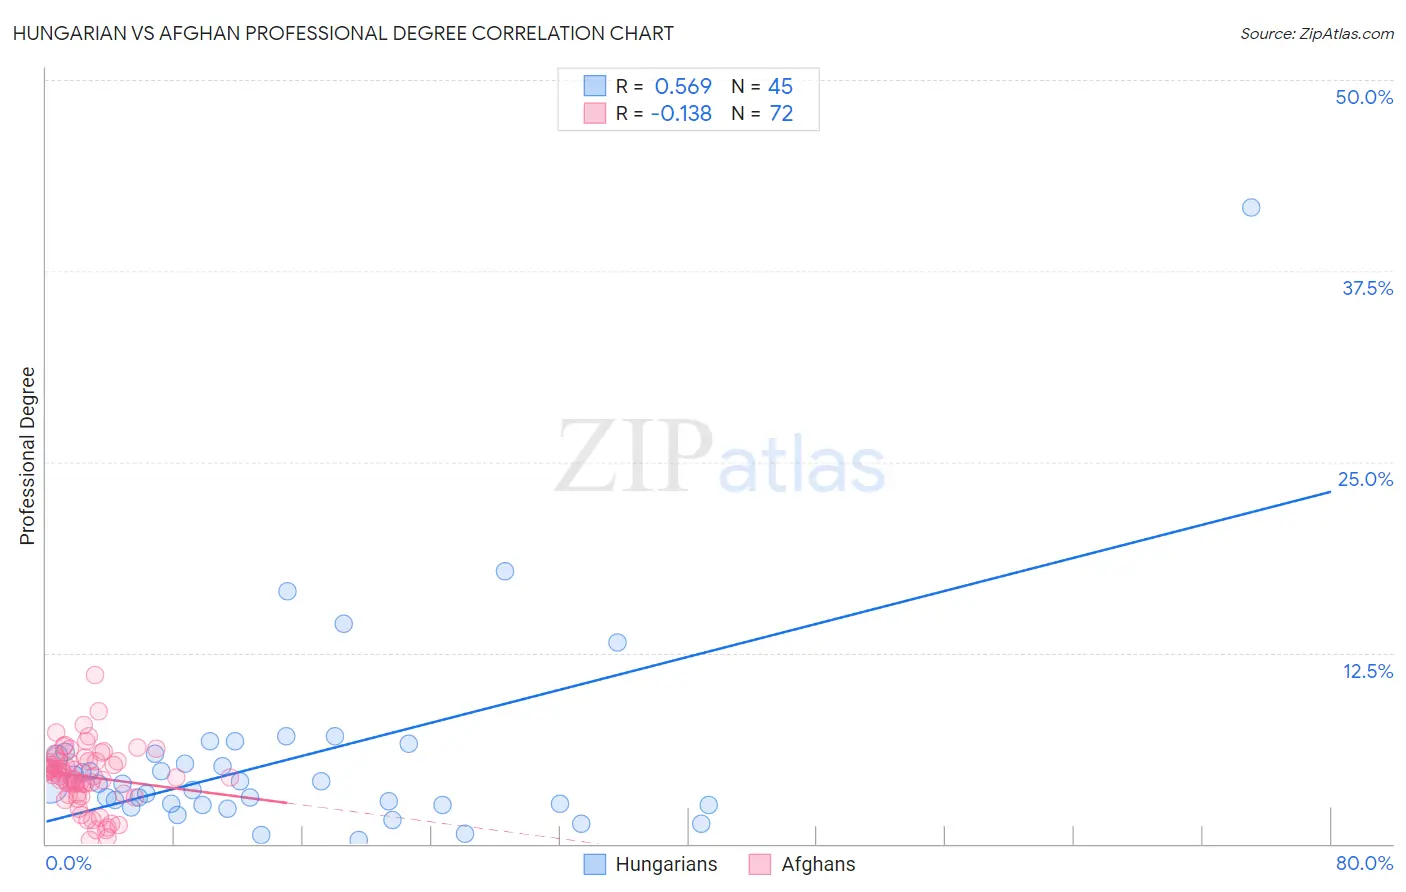
Hungarian vs Afghan Professional Degree Correlation Chart
The statistical analysis conducted on geographies consisting of 483,808,546 people shows a substantial positive correlation between the proportion of Hungarians and percentage of population with at least professional degree education in the United States with a correlation coefficient (R) of 0.569 and weighted average of 4.6%. Similarly, the statistical analysis conducted on geographies consisting of 148,828,949 people shows a poor negative correlation between the proportion of Afghans and percentage of population with at least professional degree education in the United States with a correlation coefficient (R) of -0.138 and weighted average of 4.7%, a difference of 2.2%.
Professional Degree Correlation Summary
| Measurement | Hungarian | Afghan |
| Minimum | 0.21% | 0.26% |
| Maximum | 41.7% | 11.1% |
| Range | 41.5% | 10.8% |
| Mean | 5.6% | 4.4% |
| Median | 3.9% | 4.5% |
| Interquartile 25% (IQ1) | 2.5% | 3.3% |
| Interquartile 75% (IQ3) | 5.9% | 5.4% |
| Interquartile Range (IQR) | 3.4% | 2.1% |
| Standard Deviation (Sample) | 6.7% | 1.9% |
| Standard Deviation (Population) | 6.6% | 1.9% |
Demographics Similar to Hungarians and Afghans by Professional Degree
In terms of professional degree, the demographic groups most similar to Hungarians are Immigrants from South America (4.6%, a difference of 0.070%), Sudanese (4.6%, a difference of 0.11%), Uruguayan (4.6%, a difference of 0.13%), Basque (4.6%, a difference of 0.24%), and Luxembourger (4.6%, a difference of 0.44%). Similarly, the demographic groups most similar to Afghans are Jordanian (4.7%, a difference of 0.040%), Immigrants from Jordan (4.7%, a difference of 0.060%), Macedonian (4.8%, a difference of 0.34%), South American Indian (4.8%, a difference of 0.38%), and Italian (4.8%, a difference of 0.50%).
| Demographics | Rating | Rank | Professional Degree |
| Icelanders | 91.5 /100 | #130 | Exceptional 4.8% |
| Immigrants | Nepal | 91.4 /100 | #131 | Exceptional 4.8% |
| Pakistanis | 90.9 /100 | #132 | Exceptional 4.8% |
| Italians | 90.2 /100 | #133 | Exceptional 4.8% |
| South American Indians | 89.9 /100 | #134 | Excellent 4.8% |
| Macedonians | 89.8 /100 | #135 | Excellent 4.8% |
| Immigrants | Jordan | 89.0 /100 | #136 | Excellent 4.7% |
| Jordanians | 88.9 /100 | #137 | Excellent 4.7% |
| Afghans | 88.8 /100 | #138 | Excellent 4.7% |
| South Americans | 85.6 /100 | #139 | Excellent 4.7% |
| Canadians | 84.4 /100 | #140 | Excellent 4.7% |
| Basques | 81.8 /100 | #141 | Excellent 4.6% |
| Sudanese | 81.3 /100 | #142 | Excellent 4.6% |
| Hungarians | 80.8 /100 | #143 | Excellent 4.6% |
| Immigrants | South America | 80.5 /100 | #144 | Excellent 4.6% |
| Uruguayans | 80.2 /100 | #145 | Excellent 4.6% |
| Luxembourgers | 78.7 /100 | #146 | Good 4.6% |
| Colombians | 77.7 /100 | #147 | Good 4.6% |
| Slovenes | 76.1 /100 | #148 | Good 4.6% |
| Senegalese | 75.3 /100 | #149 | Good 4.6% |
| Immigrants | Oceania | 73.4 /100 | #150 | Good 4.6% |