Immigrants from Albania vs Afghan Professional Degree
COMPARE
Immigrants from Albania
Afghan
Professional Degree
Professional Degree Comparison
Immigrants from Albania
Afghans
4.8%
PROFESSIONAL DEGREE
93.3/ 100
METRIC RATING
125th/ 347
METRIC RANK
4.7%
PROFESSIONAL DEGREE
88.8/ 100
METRIC RATING
138th/ 347
METRIC RANK
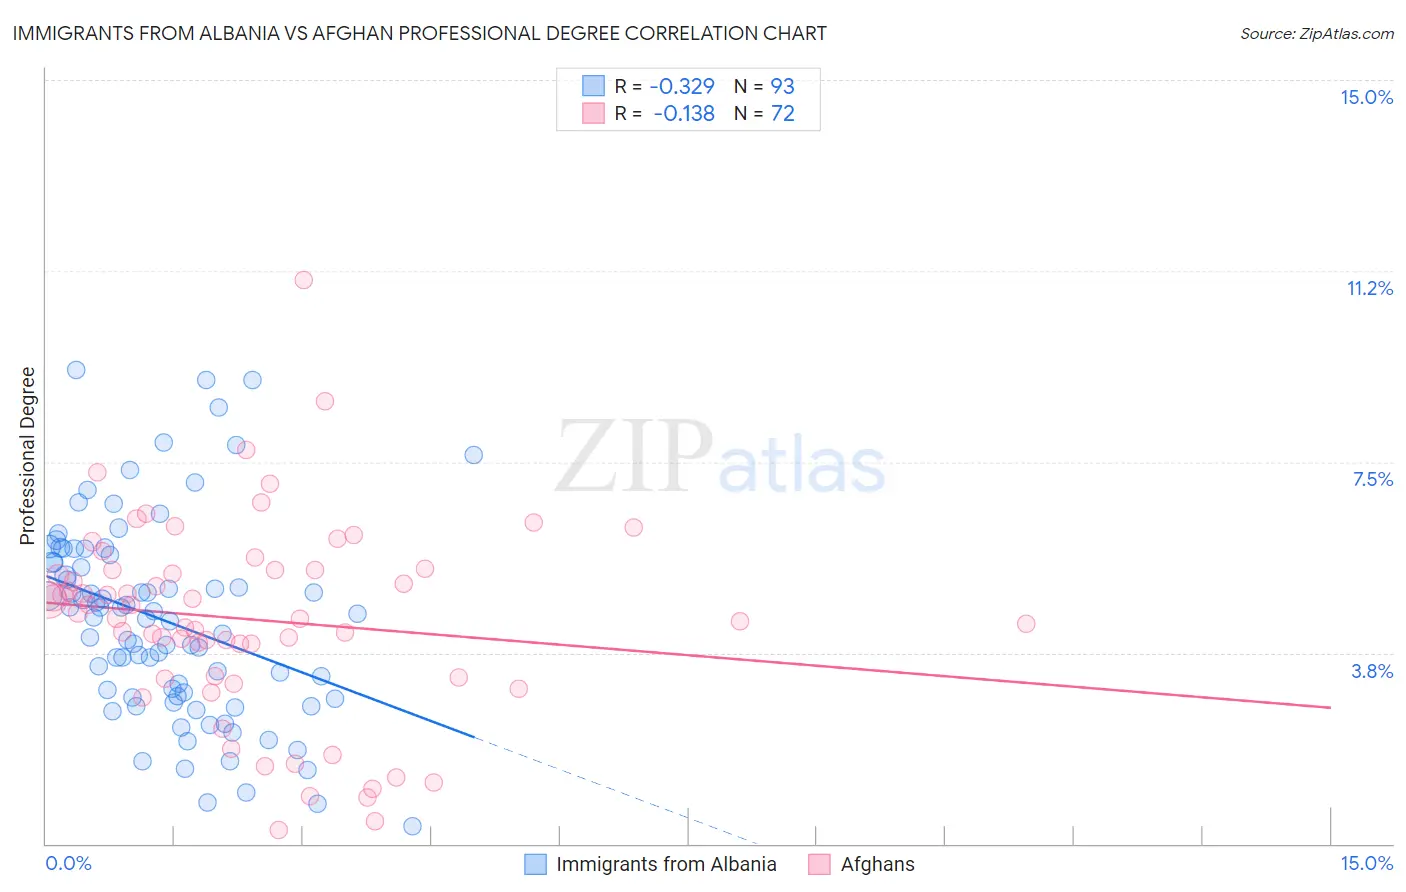
Immigrants from Albania vs Afghan Professional Degree Correlation Chart
The statistical analysis conducted on geographies consisting of 119,335,838 people shows a mild negative correlation between the proportion of Immigrants from Albania and percentage of population with at least professional degree education in the United States with a correlation coefficient (R) of -0.329 and weighted average of 4.8%. Similarly, the statistical analysis conducted on geographies consisting of 148,828,949 people shows a poor negative correlation between the proportion of Afghans and percentage of population with at least professional degree education in the United States with a correlation coefficient (R) of -0.138 and weighted average of 4.7%, a difference of 1.9%.
Professional Degree Correlation Summary
| Measurement | Immigrants from Albania | Afghan |
| Minimum | 0.35% | 0.26% |
| Maximum | 9.3% | 11.1% |
| Range | 8.9% | 10.8% |
| Mean | 4.4% | 4.4% |
| Median | 4.4% | 4.5% |
| Interquartile 25% (IQ1) | 2.9% | 3.3% |
| Interquartile 75% (IQ3) | 5.6% | 5.4% |
| Interquartile Range (IQR) | 2.7% | 2.1% |
| Standard Deviation (Sample) | 2.0% | 1.9% |
| Standard Deviation (Population) | 1.9% | 1.9% |
Demographics Similar to Immigrants from Albania and Afghans by Professional Degree
In terms of professional degree, the demographic groups most similar to Immigrants from Albania are European (4.8%, a difference of 0.050%), Immigrants from Eritrea (4.8%, a difference of 0.12%), Immigrants from Venezuela (4.8%, a difference of 0.31%), Serbian (4.8%, a difference of 0.35%), and Immigrants from Eastern Africa (4.8%, a difference of 0.37%). Similarly, the demographic groups most similar to Afghans are Jordanian (4.7%, a difference of 0.040%), Immigrants from Jordan (4.7%, a difference of 0.060%), Macedonian (4.8%, a difference of 0.34%), South American Indian (4.8%, a difference of 0.38%), and Italian (4.8%, a difference of 0.50%).
| Demographics | Rating | Rank | Professional Degree |
| Immigrants | Moldova | 94.8 /100 | #121 | Exceptional 4.9% |
| Immigrants | Germany | 94.1 /100 | #122 | Exceptional 4.9% |
| Immigrants | Venezuela | 93.8 /100 | #123 | Exceptional 4.8% |
| Immigrants | Eritrea | 93.5 /100 | #124 | Exceptional 4.8% |
| Immigrants | Albania | 93.3 /100 | #125 | Exceptional 4.8% |
| Europeans | 93.2 /100 | #126 | Exceptional 4.8% |
| Serbians | 92.6 /100 | #127 | Exceptional 4.8% |
| Immigrants | Eastern Africa | 92.5 /100 | #128 | Exceptional 4.8% |
| Palestinians | 91.5 /100 | #129 | Exceptional 4.8% |
| Icelanders | 91.5 /100 | #130 | Exceptional 4.8% |
| Immigrants | Nepal | 91.4 /100 | #131 | Exceptional 4.8% |
| Pakistanis | 90.9 /100 | #132 | Exceptional 4.8% |
| Italians | 90.2 /100 | #133 | Exceptional 4.8% |
| South American Indians | 89.9 /100 | #134 | Excellent 4.8% |
| Macedonians | 89.8 /100 | #135 | Excellent 4.8% |
| Immigrants | Jordan | 89.0 /100 | #136 | Excellent 4.7% |
| Jordanians | 88.9 /100 | #137 | Excellent 4.7% |
| Afghans | 88.8 /100 | #138 | Excellent 4.7% |
| South Americans | 85.6 /100 | #139 | Excellent 4.7% |
| Canadians | 84.4 /100 | #140 | Excellent 4.7% |
| Basques | 81.8 /100 | #141 | Excellent 4.6% |