Hungarian vs Immigrants from Peru Professional Degree

COMPARE

Hungarian
Race
Ancestry
AfghanAfricanAlaska NativeAlaskan AthabascanAlbanianAleutAlsatianAmericanApacheArabArapahoArgentineanArmenianAssyrian/Chaldean/SyriacAustralianAustrianBahamianBangladeshiBarbadianBasqueBelgianBelizeanBermudanBhutaneseBlackfeetBolivianBrazilianBritishBritish West IndianBulgarianBurmeseCajunCambodianCanadianCape VerdeanCarpatho RusynCelticCentral AmericanCentral American IndianCherokeeCheyenneChickasawChileanChineseChippewaChoctawColombianColvilleComancheCosta RicanCreeCreekCroatianCrowCubanCypriotCzechCzechoslovakianDanishDelawareDominicanDutchDutch West IndianEastern EuropeanEcuadorianEgyptianEnglishEstonianEthiopianEuropeanFijianFilipinoFinnishFrenchFrench American IndianFrench CanadianGermanGerman RussianGhanaianGreekGuamanian/ChamorroGuatemalanGuyaneseHaitianHmongHonduranHopiHoumaHungarianIcelanderIndian (Asian)IndonesianInupiatIranianIraqiIrishIroquoisIsraeliItalianJamaicanJapaneseJordanianKenyanKiowaKoreanLaotianLatvianLebaneseLiberianLithuanianLumbeeLuxembourgerMacedonianMalaysianMalteseMarshalleseMenomineeMexicanMexican American IndianMongolianMoroccanNative HawaiianNavajoNepaleseNew ZealanderNicaraguanNigerianNorthern EuropeanNorwegianOkinawanOsageOttawaPaiutePakistaniPalestinianPanamanianParaguayanPennsylvania GermanPeruvianPimaPolishPortuguesePotawatomiPuebloPuerto RicanPuget Sound SalishRomanianRussianSalvadoranSamoanScandinavianScotch-IrishScottishSeminoleSenegaleseSerbianShoshoneSierra LeoneanSiouxSlavicSlovakSloveneSomaliSouth AfricanSouth AmericanSouth American IndianSoviet UnionSpaniardSpanishSpanish AmericanSpanish American IndianSri LankanSubsaharan AfricanSudaneseSwedishSwissSyrianTaiwaneseThaiTlingit-HaidaTohono O'OdhamTonganTrinidadian and TobagonianTsimshianTurkishU.S. Virgin IslanderUgandanUkrainianUruguayanUteVenezuelanVietnameseWelshWest IndianYakamaYaquiYugoslavianYumanYup'ikZimbabwean
Immigration
NonimmigrantsImmigrantsAfghanistanAfricaAlbaniaArgentinaArmeniaAsiaAustraliaAustriaBahamasBangladeshBarbadosBelarusBelgiumBelizeBoliviaBosnia and HerzegovinaBrazilBulgariaBurma/MyanmarCabo VerdeCambodiaCameroonCanadaCaribbeanCentral AmericaChileChinaColombiaCongoCosta RicaCroatiaCubaCzechoslovakiaDenmarkDominicaDominican RepublicEastern AfricaEastern AsiaEastern EuropeEcuadorEgyptEl SalvadorEnglandEritreaEthiopiaEuropeFijiFranceGermanyGhanaGreeceGrenadaGuatemalaGuyanaHaitiHondurasHong KongHungaryIndiaIndonesiaIranIraqIrelandIsraelItalyJamaicaJapanJordanKazakhstanKenyaKoreaKuwaitLaosLatin AmericaLatviaLebanonLiberiaLithuaniaMalaysiaMexicoMicronesiaMiddle AfricaMoldovaMoroccoNepalNetherlandsNicaraguaNigeriaNorth AmericaNorth MacedoniaNorthern AfricaNorthern EuropeNorwayOceaniaPakistanPanamaPhilippinesPolandPortugalRomaniaRussiaSaudi ArabiaScotlandSenegalSerbiaSierra LeoneSingaporeSomaliaSouth AfricaSouth AmericaSouth Central AsiaSouth Eastern AsiaSouthern EuropeSpainSri LankaSt. Vincent and the GrenadinesSudanSwedenSwitzerlandSyriaTaiwanThailandTrinidad and TobagoTurkeyUgandaUkraineUruguayUzbekistanVenezuelaVietnamWest IndiesWestern AfricaWestern AsiaWestern EuropeYemenZaireZimbabweAzores
Immigrants from Peru
Race
Ancestry
AfghanAfricanAlaska NativeAlaskan AthabascanAlbanianAleutAlsatianAmericanApacheArabArapahoArgentineanArmenianAssyrian/Chaldean/SyriacAustralianAustrianBahamianBangladeshiBarbadianBasqueBelgianBelizeanBermudanBhutaneseBlackfeetBolivianBrazilianBritishBritish West IndianBulgarianBurmeseCajunCambodianCanadianCape VerdeanCarpatho RusynCelticCentral AmericanCentral American IndianCherokeeCheyenneChickasawChileanChineseChippewaChoctawColombianColvilleComancheCosta RicanCreeCreekCroatianCrowCubanCypriotCzechCzechoslovakianDanishDelawareDominicanDutchDutch West IndianEastern EuropeanEcuadorianEgyptianEnglishEstonianEthiopianEuropeanFijianFilipinoFinnishFrenchFrench American IndianFrench CanadianGermanGerman RussianGhanaianGreekGuamanian/ChamorroGuatemalanGuyaneseHaitianHmongHonduranHopiHoumaIcelanderIndian (Asian)IndonesianInupiatIranianIraqiIrishIroquoisIsraeliItalianJamaicanJapaneseJordanianKenyanKiowaKoreanLaotianLatvianLebaneseLiberianLithuanianLumbeeLuxembourgerMacedonianMalaysianMalteseMarshalleseMenomineeMexicanMexican American IndianMongolianMoroccanNative HawaiianNavajoNepaleseNew ZealanderNicaraguanNigerianNorthern EuropeanNorwegianOkinawanOsageOttawaPaiutePakistaniPalestinianPanamanianParaguayanPennsylvania GermanPeruvianPimaPolishPortuguesePotawatomiPuebloPuerto RicanPuget Sound SalishRomanianRussianSalvadoranSamoanScandinavianScotch-IrishScottishSeminoleSenegaleseSerbianShoshoneSierra LeoneanSiouxSlavicSlovakSloveneSomaliSouth AfricanSouth AmericanSouth American IndianSoviet UnionSpaniardSpanishSpanish AmericanSpanish American IndianSri LankanSubsaharan AfricanSudaneseSwedishSwissSyrianTaiwaneseThaiTlingit-HaidaTohono O'OdhamTonganTrinidadian and TobagonianTsimshianTurkishU.S. Virgin IslanderUgandanUkrainianUruguayanUteVenezuelanVietnameseWelshWest IndianYakamaYaquiYugoslavianYumanYup'ikZimbabwean
Immigration
NonimmigrantsImmigrantsAfghanistanAfricaAlbaniaArgentinaArmeniaAsiaAustraliaAustriaBahamasBangladeshBarbadosBelarusBelgiumBelizeBoliviaBosnia and HerzegovinaBrazilBulgariaBurma/MyanmarCabo VerdeCambodiaCameroonCanadaCaribbeanCentral AmericaChileChinaColombiaCongoCosta RicaCroatiaCubaCzechoslovakiaDenmarkDominicaDominican RepublicEastern AfricaEastern AsiaEastern EuropeEcuadorEgyptEl SalvadorEnglandEritreaEthiopiaEuropeFijiFranceGermanyGhanaGreeceGrenadaGuatemalaGuyanaHaitiHondurasHong KongHungaryIndiaIndonesiaIranIraqIrelandIsraelItalyJamaicaJapanJordanKazakhstanKenyaKoreaKuwaitLaosLatin AmericaLatviaLebanonLiberiaLithuaniaMalaysiaMexicoMicronesiaMiddle AfricaMoldovaMoroccoNepalNetherlandsNicaraguaNigeriaNorth AmericaNorth MacedoniaNorthern AfricaNorthern EuropeNorwayOceaniaPakistanPanamaPeruPhilippinesPolandPortugalRomaniaRussiaSaudi ArabiaScotlandSenegalSerbiaSierra LeoneSingaporeSomaliaSouth AfricaSouth AmericaSouth Central AsiaSouth Eastern AsiaSouthern EuropeSpainSri LankaSt. Vincent and the GrenadinesSudanSwedenSwitzerlandSyriaTaiwanThailandTrinidad and TobagoTurkeyUgandaUkraineUruguayUzbekistanVenezuelaVietnamWest IndiesWestern AfricaWestern AsiaWestern EuropeYemenZaireZimbabweAzores
Professional Degree
Income
Poverty
Unemployment
Labor Participation
Family Structure
Vehicle Availability
Education Level
Disability

Professional Degree Comparison

Hungarians

Immigrants from Peru

Excellent
Average
4.6%
PROFESSIONAL DEGREE
80.8/ 100
METRIC RATING
143rd/ 347
METRIC RANK
4.4%
PROFESSIONAL DEGREE
49.3/ 100
METRIC RATING
176th/ 347
METRIC RANK

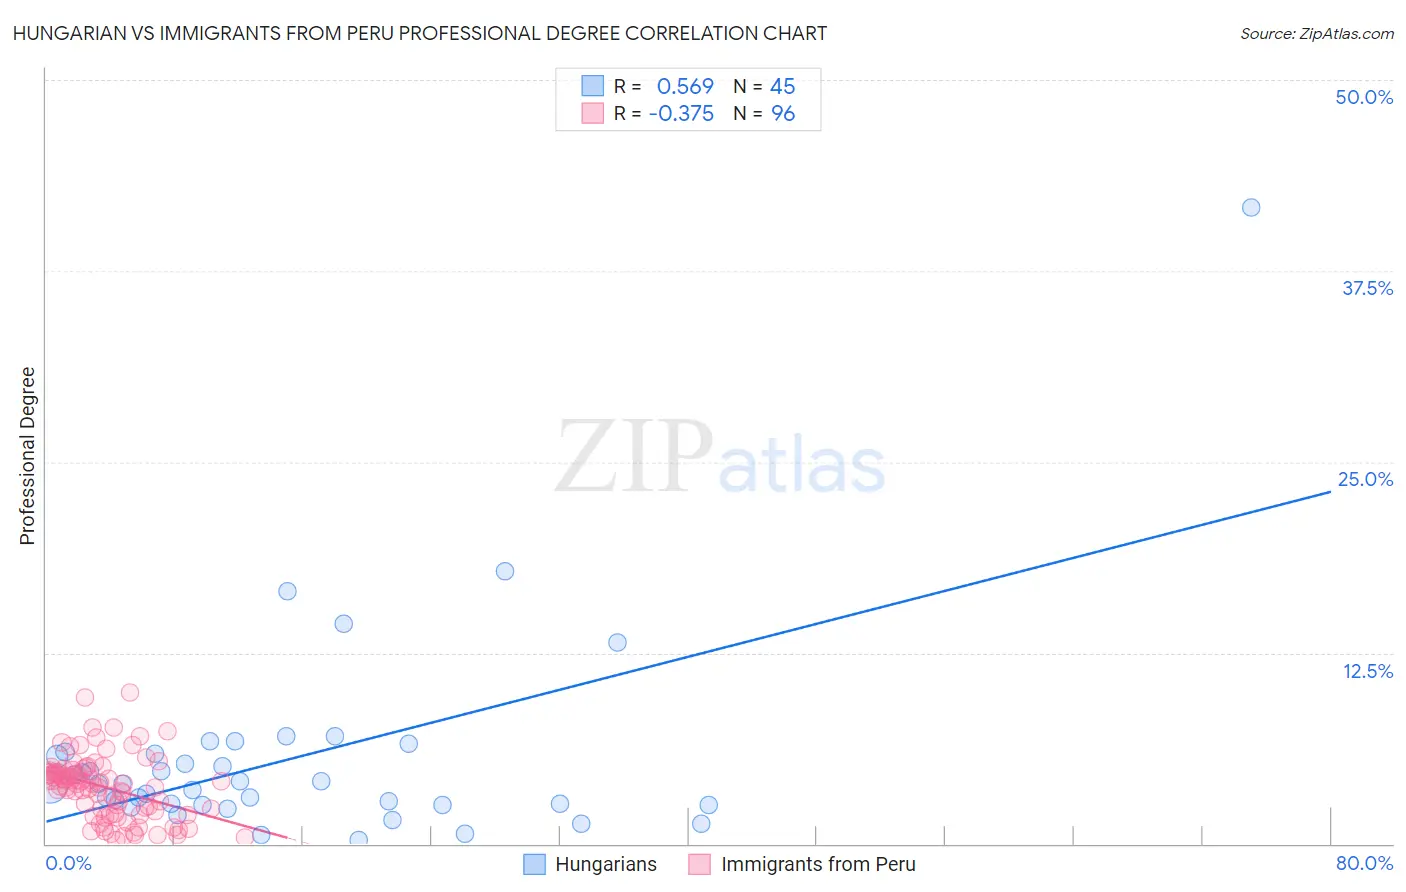
Hungarian vs Immigrants from Peru Professional Degree Correlation Chart

The statistical analysis conducted on geographies consisting of 483,808,546 people shows a substantial positive correlation between the proportion of Hungarians and percentage of population with at least professional degree education in the United States with a correlation coefficient (R) of 0.569 and weighted average of 4.6%. Similarly, the statistical analysis conducted on geographies consisting of 328,575,904 people shows a mild negative correlation between the proportion of Immigrants from Peru and percentage of population with at least professional degree education in the United States with a correlation coefficient (R) of -0.375 and weighted average of 4.4%, a difference of 5.3%.
Hungarian vs Immigrants from Peru Professional Degree

Professional Degree Correlation Summary

MeasurementHungarianImmigrants from Peru
Minimum0.21%0.24%
Maximum41.7%9.9%
Range41.5%9.7%
Mean5.6%3.7%
Median3.9%3.9%
Interquartile 25% (IQ1)2.5%2.0%
Interquartile 75% (IQ3)5.9%4.7%
Interquartile Range (IQR)3.4%2.7%
Standard Deviation (Sample)6.7%2.0%
Standard Deviation (Population)6.6%2.0%

Similar Demographics by Professional Degree

Demographics Similar to Hungarians by Professional Degree

In terms of professional degree, the demographic groups most similar to Hungarians are Immigrants from South America (4.6%, a difference of 0.070%), Sudanese (4.6%, a difference of 0.11%), Uruguayan (4.6%, a difference of 0.13%), Basque (4.6%, a difference of 0.24%), and Luxembourger (4.6%, a difference of 0.44%).
DemographicsRating | RankProfessional Degree
Immigrants | Jordan
89.0
/100
|
#136
Excellent
4.7%
Jordanians
88.9
/100
|
#137
Excellent
4.7%
Afghans
88.8
/100
|
#138
Excellent
4.7%
South Americans
85.6
/100
|
#139
Excellent
4.7%
Canadians
84.4
/100
|
#140
Excellent
4.7%
Basques
81.8
/100
|
#141
Excellent
4.6%
Sudanese
81.3
/100
|
#142
Excellent
4.6%
Hungarians
80.8
/100
|
#143
Excellent
4.6%
Immigrants | South America
80.5
/100
|
#144
Excellent
4.6%
Uruguayans
80.2
/100
|
#145
Excellent
4.6%
Luxembourgers
78.7
/100
|
#146
Good
4.6%
Colombians
77.7
/100
|
#147
Good
4.6%
Slovenes
76.1
/100
|
#148
Good
4.6%
Senegalese
75.3
/100
|
#149
Good
4.6%
Immigrants | Oceania
73.4
/100
|
#150
Good
4.6%

Demographics Similar to Immigrants from Peru by Professional Degree

In terms of professional degree, the demographic groups most similar to Immigrants from Peru are Kenyan (4.4%, a difference of 0.10%), Irish (4.4%, a difference of 0.10%), English (4.4%, a difference of 0.11%), Celtic (4.4%, a difference of 0.25%), and Spaniard (4.4%, a difference of 0.39%).
DemographicsRating | RankProfessional Degree
Chinese
58.6
/100
|
#169
Average
4.5%
Immigrants | Zaire
57.4
/100
|
#170
Average
4.5%
Immigrants | Bangladesh
56.0
/100
|
#171
Average
4.4%
Spaniards
52.0
/100
|
#172
Average
4.4%
English
50.1
/100
|
#173
Average
4.4%
Kenyans
50.0
/100
|
#174
Average
4.4%
Irish
50.0
/100
|
#175
Average
4.4%
Immigrants | Peru
49.3
/100
|
#176
Average
4.4%
Celtics
47.6
/100
|
#177
Average
4.4%
Immigrants | Costa Rica
46.7
/100
|
#178
Average
4.4%
Immigrants | Kenya
45.9
/100
|
#179
Average
4.4%
Czechs
44.9
/100
|
#180
Average
4.4%
Danes
43.5
/100
|
#181
Average
4.4%
Immigrants | Immigrants
43.2
/100
|
#182
Average
4.4%
Bermudans
43.1
/100
|
#183
Average
4.4%