Hopi vs Immigrants from West Indies Professional Degree
COMPARE
Hopi
Immigrants from West Indies
Professional Degree
Professional Degree Comparison
Hopi
Immigrants from West Indies
3.6%
PROFESSIONAL DEGREE
0.9/ 100
METRIC RATING
263rd/ 347
METRIC RANK
4.0%
PROFESSIONAL DEGREE
5.6/ 100
METRIC RATING
228th/ 347
METRIC RANK
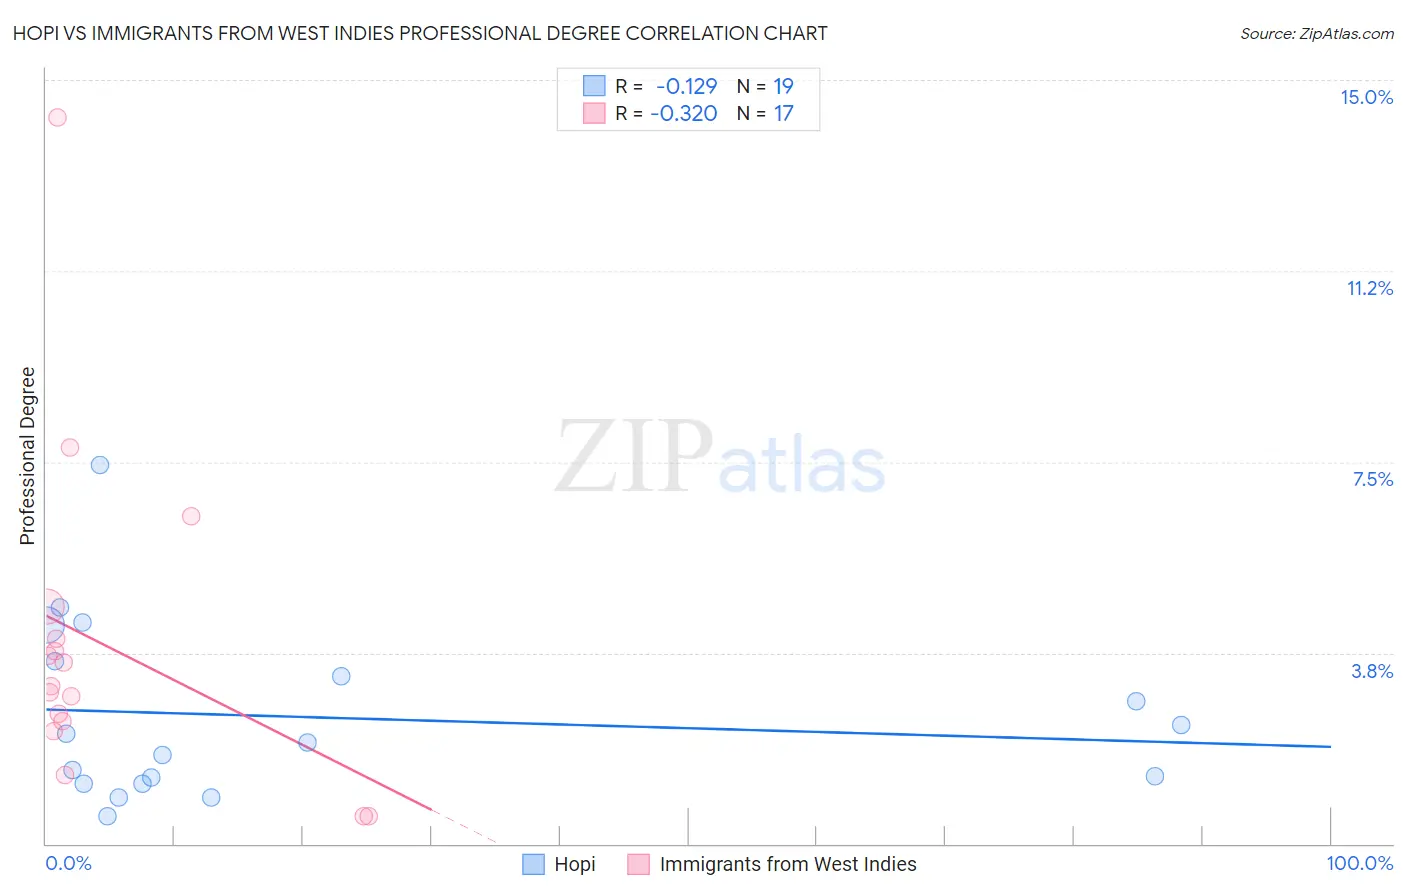
Hopi vs Immigrants from West Indies Professional Degree Correlation Chart
The statistical analysis conducted on geographies consisting of 74,597,003 people shows a poor negative correlation between the proportion of Hopi and percentage of population with at least professional degree education in the United States with a correlation coefficient (R) of -0.129 and weighted average of 3.6%. Similarly, the statistical analysis conducted on geographies consisting of 72,432,787 people shows a mild negative correlation between the proportion of Immigrants from West Indies and percentage of population with at least professional degree education in the United States with a correlation coefficient (R) of -0.320 and weighted average of 4.0%, a difference of 8.5%.
Professional Degree Correlation Summary
| Measurement | Hopi | Immigrants from West Indies |
| Minimum | 0.54% | 0.54% |
| Maximum | 7.4% | 14.3% |
| Range | 6.9% | 13.7% |
| Mean | 2.5% | 3.9% |
| Median | 2.0% | 3.1% |
| Interquartile 25% (IQ1) | 1.2% | 2.3% |
| Interquartile 75% (IQ3) | 3.6% | 4.3% |
| Interquartile Range (IQR) | 2.4% | 2.0% |
| Standard Deviation (Sample) | 1.7% | 3.2% |
| Standard Deviation (Population) | 1.7% | 3.1% |
Similar Demographics by Professional Degree
Demographics Similar to Hopi by Professional Degree
In terms of professional degree, the demographic groups most similar to Hopi are Immigrants from Cambodia (3.6%, a difference of 0.020%), Immigrants from Congo (3.6%, a difference of 0.060%), Central American Indian (3.6%, a difference of 0.38%), U.S. Virgin Islander (3.7%, a difference of 0.50%), and Immigrants from Guyana (3.7%, a difference of 0.51%).
| Demographics | Rating | Rank | Professional Degree |
| Iroquois | 1.2 /100 | #256 | Tragic 3.7% |
| Bahamians | 1.1 /100 | #257 | Tragic 3.7% |
| Immigrants | St. Vincent and the Grenadines | 1.1 /100 | #258 | Tragic 3.7% |
| Africans | 1.0 /100 | #259 | Tragic 3.7% |
| Indonesians | 1.0 /100 | #260 | Tragic 3.7% |
| Immigrants | Guyana | 1.0 /100 | #261 | Tragic 3.7% |
| U.S. Virgin Islanders | 1.0 /100 | #262 | Tragic 3.7% |
| Hopi | 0.9 /100 | #263 | Tragic 3.6% |
| Immigrants | Cambodia | 0.9 /100 | #264 | Tragic 3.6% |
| Immigrants | Congo | 0.8 /100 | #265 | Tragic 3.6% |
| Central American Indians | 0.8 /100 | #266 | Tragic 3.6% |
| Delaware | 0.7 /100 | #267 | Tragic 3.6% |
| Aleuts | 0.7 /100 | #268 | Tragic 3.6% |
| Immigrants | Cuba | 0.6 /100 | #269 | Tragic 3.6% |
| Central Americans | 0.6 /100 | #270 | Tragic 3.6% |
Demographics Similar to Immigrants from West Indies by Professional Degree
In terms of professional degree, the demographic groups most similar to Immigrants from West Indies are Immigrants from Burma/Myanmar (3.9%, a difference of 0.14%), Cuban (4.0%, a difference of 0.25%), German Russian (4.0%, a difference of 0.37%), Nicaraguan (3.9%, a difference of 0.42%), and Ecuadorian (3.9%, a difference of 0.87%).
| Demographics | Rating | Rank | Professional Degree |
| French Canadians | 8.0 /100 | #221 | Tragic 4.0% |
| Immigrants | Western Africa | 7.5 /100 | #222 | Tragic 4.0% |
| Immigrants | Bosnia and Herzegovina | 7.4 /100 | #223 | Tragic 4.0% |
| Trinidadians and Tobagonians | 7.1 /100 | #224 | Tragic 4.0% |
| Tlingit-Haida | 6.9 /100 | #225 | Tragic 4.0% |
| German Russians | 6.1 /100 | #226 | Tragic 4.0% |
| Cubans | 5.9 /100 | #227 | Tragic 4.0% |
| Immigrants | West Indies | 5.6 /100 | #228 | Tragic 4.0% |
| Immigrants | Burma/Myanmar | 5.4 /100 | #229 | Tragic 3.9% |
| Nicaraguans | 5.1 /100 | #230 | Tragic 3.9% |
| Ecuadorians | 4.6 /100 | #231 | Tragic 3.9% |
| Cree | 4.3 /100 | #232 | Tragic 3.9% |
| Immigrants | Philippines | 4.1 /100 | #233 | Tragic 3.9% |
| Immigrants | Nonimmigrants | 4.0 /100 | #234 | Tragic 3.9% |
| Immigrants | Barbados | 4.0 /100 | #235 | Tragic 3.9% |