Hopi vs Soviet Union Professional Degree
COMPARE
Hopi
Soviet Union
Professional Degree
Professional Degree Comparison
Hopi
Soviet Union
3.6%
PROFESSIONAL DEGREE
0.9/ 100
METRIC RATING
263rd/ 347
METRIC RANK
6.6%
PROFESSIONAL DEGREE
100.0/ 100
METRIC RATING
18th/ 347
METRIC RANK
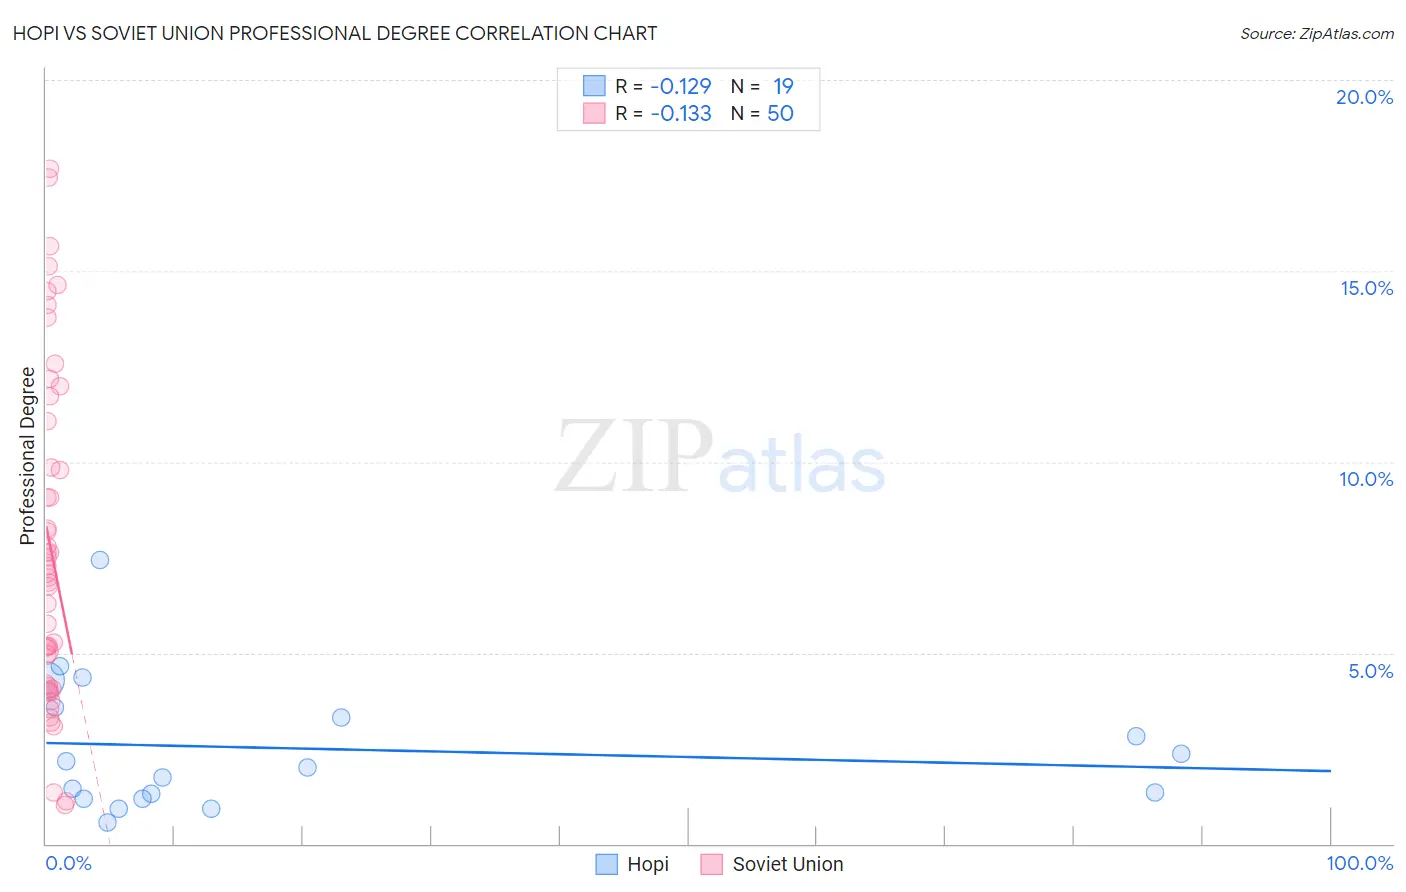
Hopi vs Soviet Union Professional Degree Correlation Chart
The statistical analysis conducted on geographies consisting of 74,597,003 people shows a poor negative correlation between the proportion of Hopi and percentage of population with at least professional degree education in the United States with a correlation coefficient (R) of -0.129 and weighted average of 3.6%. Similarly, the statistical analysis conducted on geographies consisting of 43,509,630 people shows a poor negative correlation between the proportion of Soviet Union and percentage of population with at least professional degree education in the United States with a correlation coefficient (R) of -0.133 and weighted average of 6.6%, a difference of 80.1%.
Professional Degree Correlation Summary
| Measurement | Hopi | Soviet Union |
| Minimum | 0.54% | 1.0% |
| Maximum | 7.4% | 17.7% |
| Range | 6.9% | 16.7% |
| Mean | 2.5% | 7.8% |
| Median | 2.0% | 7.0% |
| Interquartile 25% (IQ1) | 1.2% | 4.1% |
| Interquartile 75% (IQ3) | 3.6% | 11.1% |
| Interquartile Range (IQR) | 2.4% | 6.9% |
| Standard Deviation (Sample) | 1.7% | 4.4% |
| Standard Deviation (Population) | 1.7% | 4.3% |
Similar Demographics by Professional Degree
Demographics Similar to Hopi by Professional Degree
In terms of professional degree, the demographic groups most similar to Hopi are Immigrants from Cambodia (3.6%, a difference of 0.020%), Immigrants from Congo (3.6%, a difference of 0.060%), Central American Indian (3.6%, a difference of 0.38%), U.S. Virgin Islander (3.7%, a difference of 0.50%), and Immigrants from Guyana (3.7%, a difference of 0.51%).
| Demographics | Rating | Rank | Professional Degree |
| Iroquois | 1.2 /100 | #256 | Tragic 3.7% |
| Bahamians | 1.1 /100 | #257 | Tragic 3.7% |
| Immigrants | St. Vincent and the Grenadines | 1.1 /100 | #258 | Tragic 3.7% |
| Africans | 1.0 /100 | #259 | Tragic 3.7% |
| Indonesians | 1.0 /100 | #260 | Tragic 3.7% |
| Immigrants | Guyana | 1.0 /100 | #261 | Tragic 3.7% |
| U.S. Virgin Islanders | 1.0 /100 | #262 | Tragic 3.7% |
| Hopi | 0.9 /100 | #263 | Tragic 3.6% |
| Immigrants | Cambodia | 0.9 /100 | #264 | Tragic 3.6% |
| Immigrants | Congo | 0.8 /100 | #265 | Tragic 3.6% |
| Central American Indians | 0.8 /100 | #266 | Tragic 3.6% |
| Delaware | 0.7 /100 | #267 | Tragic 3.6% |
| Aleuts | 0.7 /100 | #268 | Tragic 3.6% |
| Immigrants | Cuba | 0.6 /100 | #269 | Tragic 3.6% |
| Central Americans | 0.6 /100 | #270 | Tragic 3.6% |
Demographics Similar to Soviet Union by Professional Degree
In terms of professional degree, the demographic groups most similar to Soviet Union are Immigrants from Eastern Asia (6.6%, a difference of 0.020%), Indian (Asian) (6.5%, a difference of 0.66%), Immigrants from Sweden (6.7%, a difference of 2.0%), Immigrants from Denmark (6.4%, a difference of 2.2%), and Immigrants from Hong Kong (6.4%, a difference of 2.4%).
| Demographics | Rating | Rank | Professional Degree |
| Cypriots | 100.0 /100 | #11 | Exceptional 6.9% |
| Israelis | 100.0 /100 | #12 | Exceptional 6.9% |
| Immigrants | Australia | 100.0 /100 | #13 | Exceptional 6.9% |
| Immigrants | France | 100.0 /100 | #14 | Exceptional 6.8% |
| Immigrants | China | 100.0 /100 | #15 | Exceptional 6.7% |
| Immigrants | Sweden | 100.0 /100 | #16 | Exceptional 6.7% |
| Immigrants | Eastern Asia | 100.0 /100 | #17 | Exceptional 6.6% |
| Soviet Union | 100.0 /100 | #18 | Exceptional 6.6% |
| Indians (Asian) | 100.0 /100 | #19 | Exceptional 6.5% |
| Immigrants | Denmark | 100.0 /100 | #20 | Exceptional 6.4% |
| Immigrants | Hong Kong | 100.0 /100 | #21 | Exceptional 6.4% |
| Immigrants | Japan | 100.0 /100 | #22 | Exceptional 6.4% |
| Russians | 100.0 /100 | #23 | Exceptional 6.3% |
| Immigrants | Spain | 100.0 /100 | #24 | Exceptional 6.3% |
| Immigrants | Ireland | 100.0 /100 | #25 | Exceptional 6.3% |