Chippewa vs Immigrants from West Indies Professional Degree
COMPARE
Chippewa
Immigrants from West Indies
Professional Degree
Professional Degree Comparison
Chippewa
Immigrants from West Indies
3.5%
PROFESSIONAL DEGREE
0.3/ 100
METRIC RATING
290th/ 347
METRIC RANK
4.0%
PROFESSIONAL DEGREE
5.6/ 100
METRIC RATING
228th/ 347
METRIC RANK
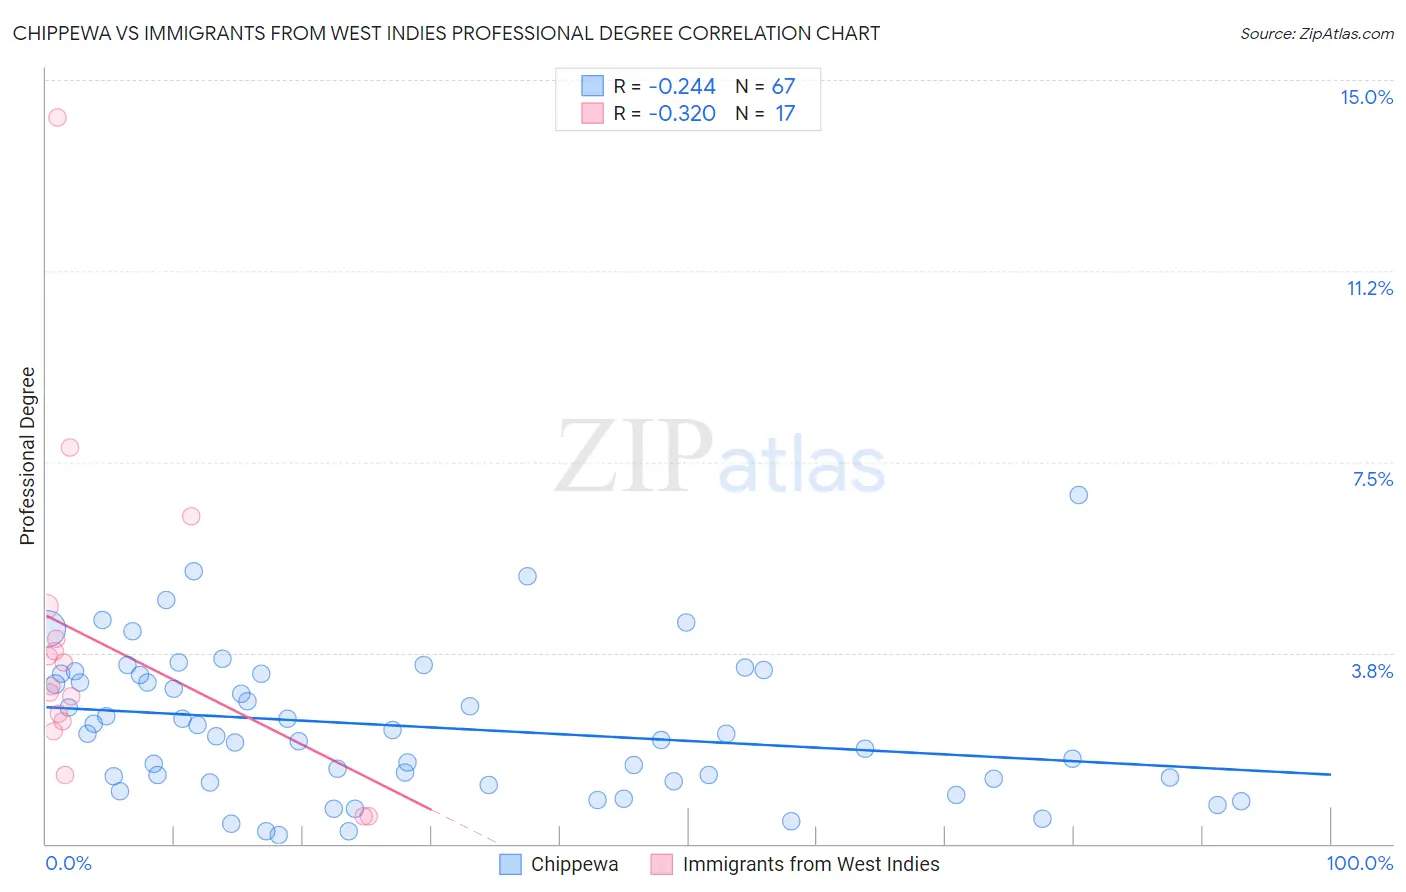
Chippewa vs Immigrants from West Indies Professional Degree Correlation Chart
The statistical analysis conducted on geographies consisting of 214,425,130 people shows a weak negative correlation between the proportion of Chippewa and percentage of population with at least professional degree education in the United States with a correlation coefficient (R) of -0.244 and weighted average of 3.5%. Similarly, the statistical analysis conducted on geographies consisting of 72,432,787 people shows a mild negative correlation between the proportion of Immigrants from West Indies and percentage of population with at least professional degree education in the United States with a correlation coefficient (R) of -0.320 and weighted average of 4.0%, a difference of 14.0%.
Professional Degree Correlation Summary
| Measurement | Chippewa | Immigrants from West Indies |
| Minimum | 0.17% | 0.54% |
| Maximum | 6.9% | 14.3% |
| Range | 6.7% | 13.7% |
| Mean | 2.3% | 3.9% |
| Median | 2.2% | 3.1% |
| Interquartile 25% (IQ1) | 1.2% | 2.3% |
| Interquartile 75% (IQ3) | 3.3% | 4.3% |
| Interquartile Range (IQR) | 2.1% | 2.0% |
| Standard Deviation (Sample) | 1.4% | 3.2% |
| Standard Deviation (Population) | 1.4% | 3.1% |
Similar Demographics by Professional Degree
Demographics Similar to Chippewa by Professional Degree
In terms of professional degree, the demographic groups most similar to Chippewa are Guatemalan (3.5%, a difference of 0.010%), Alaska Native (3.5%, a difference of 0.17%), Blackfeet (3.5%, a difference of 0.19%), Immigrants from El Salvador (3.5%, a difference of 0.23%), and Immigrants from Belize (3.5%, a difference of 0.24%).
| Demographics | Rating | Rank | Professional Degree |
| Comanche | 0.4 /100 | #283 | Tragic 3.5% |
| Salvadorans | 0.4 /100 | #284 | Tragic 3.5% |
| Hondurans | 0.3 /100 | #285 | Tragic 3.5% |
| Haitians | 0.3 /100 | #286 | Tragic 3.5% |
| Immigrants | El Salvador | 0.3 /100 | #287 | Tragic 3.5% |
| Blackfeet | 0.3 /100 | #288 | Tragic 3.5% |
| Guatemalans | 0.3 /100 | #289 | Tragic 3.5% |
| Chippewa | 0.3 /100 | #290 | Tragic 3.5% |
| Alaska Natives | 0.3 /100 | #291 | Tragic 3.5% |
| Immigrants | Belize | 0.3 /100 | #292 | Tragic 3.5% |
| Immigrants | Honduras | 0.3 /100 | #293 | Tragic 3.5% |
| Paiute | 0.3 /100 | #294 | Tragic 3.4% |
| Immigrants | Guatemala | 0.2 /100 | #295 | Tragic 3.4% |
| Hawaiians | 0.2 /100 | #296 | Tragic 3.4% |
| Immigrants | Liberia | 0.2 /100 | #297 | Tragic 3.4% |
Demographics Similar to Immigrants from West Indies by Professional Degree
In terms of professional degree, the demographic groups most similar to Immigrants from West Indies are Immigrants from Burma/Myanmar (3.9%, a difference of 0.14%), Cuban (4.0%, a difference of 0.25%), German Russian (4.0%, a difference of 0.37%), Nicaraguan (3.9%, a difference of 0.42%), and Ecuadorian (3.9%, a difference of 0.87%).
| Demographics | Rating | Rank | Professional Degree |
| French Canadians | 8.0 /100 | #221 | Tragic 4.0% |
| Immigrants | Western Africa | 7.5 /100 | #222 | Tragic 4.0% |
| Immigrants | Bosnia and Herzegovina | 7.4 /100 | #223 | Tragic 4.0% |
| Trinidadians and Tobagonians | 7.1 /100 | #224 | Tragic 4.0% |
| Tlingit-Haida | 6.9 /100 | #225 | Tragic 4.0% |
| German Russians | 6.1 /100 | #226 | Tragic 4.0% |
| Cubans | 5.9 /100 | #227 | Tragic 4.0% |
| Immigrants | West Indies | 5.6 /100 | #228 | Tragic 4.0% |
| Immigrants | Burma/Myanmar | 5.4 /100 | #229 | Tragic 3.9% |
| Nicaraguans | 5.1 /100 | #230 | Tragic 3.9% |
| Ecuadorians | 4.6 /100 | #231 | Tragic 3.9% |
| Cree | 4.3 /100 | #232 | Tragic 3.9% |
| Immigrants | Philippines | 4.1 /100 | #233 | Tragic 3.9% |
| Immigrants | Nonimmigrants | 4.0 /100 | #234 | Tragic 3.9% |
| Immigrants | Barbados | 4.0 /100 | #235 | Tragic 3.9% |