Hispanic or Latino vs Iraqi Master's Degree
COMPARE
Hispanic or Latino
Iraqi
Master's Degree
Master's Degree Comparison
Hispanics or Latinos
Iraqis
10.9%
MASTER'S DEGREE
0.0/ 100
METRIC RATING
316th/ 347
METRIC RANK
15.5%
MASTER'S DEGREE
77.3/ 100
METRIC RATING
151st/ 347
METRIC RANK
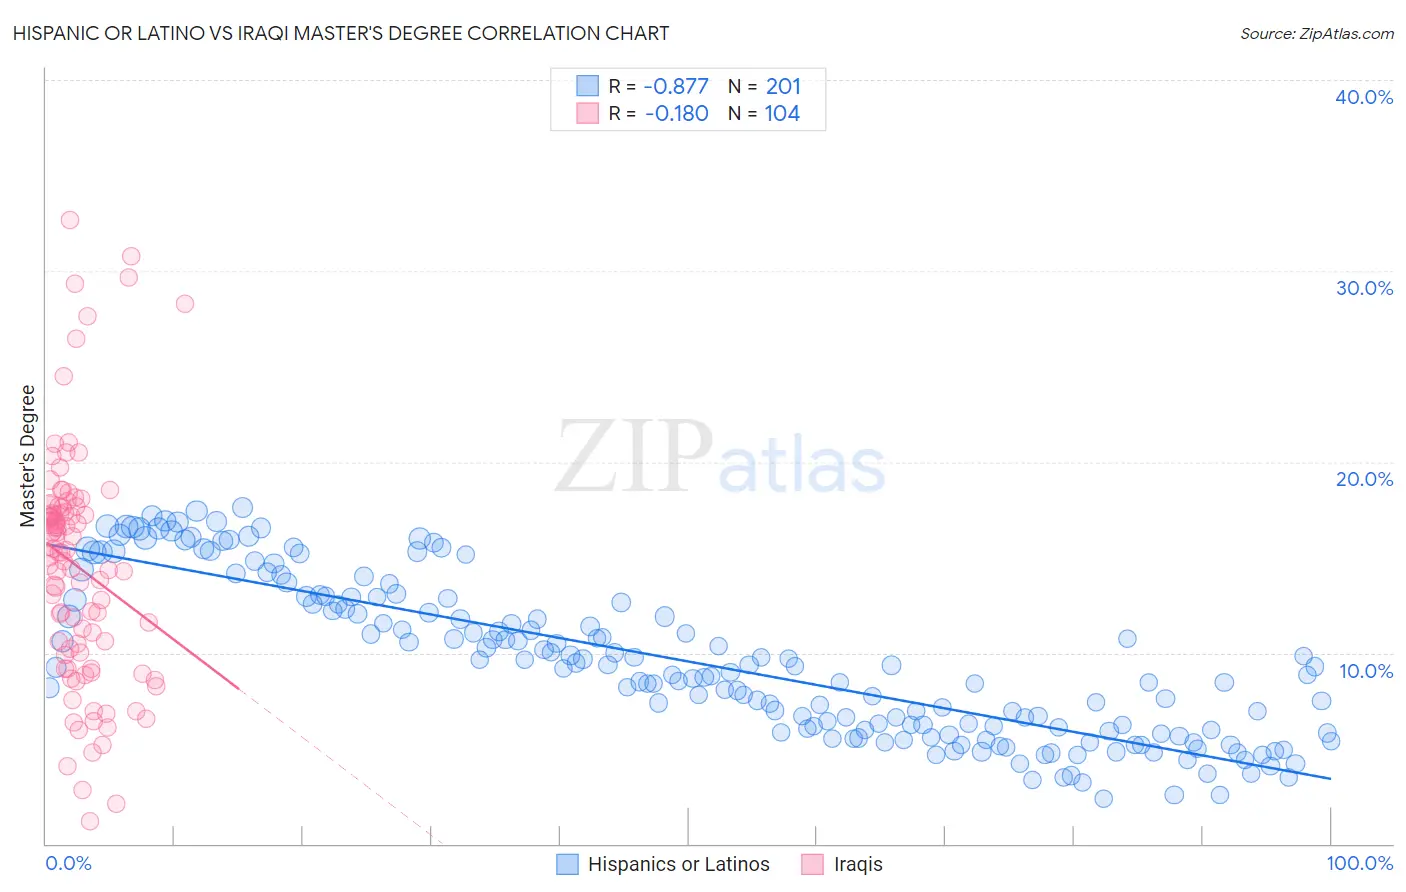
Hispanic or Latino vs Iraqi Master's Degree Correlation Chart
The statistical analysis conducted on geographies consisting of 577,228,232 people shows a very strong negative correlation between the proportion of Hispanics or Latinos and percentage of population with at least master's degree education in the United States with a correlation coefficient (R) of -0.877 and weighted average of 10.9%. Similarly, the statistical analysis conducted on geographies consisting of 170,638,714 people shows a poor negative correlation between the proportion of Iraqis and percentage of population with at least master's degree education in the United States with a correlation coefficient (R) of -0.180 and weighted average of 15.5%, a difference of 41.9%.
Master's Degree Correlation Summary
| Measurement | Hispanic or Latino | Iraqi |
| Minimum | 2.4% | 1.1% |
| Maximum | 17.6% | 32.7% |
| Range | 15.2% | 31.5% |
| Mean | 9.5% | 14.5% |
| Median | 9.2% | 15.2% |
| Interquartile 25% (IQ1) | 5.9% | 9.9% |
| Interquartile 75% (IQ3) | 12.7% | 17.6% |
| Interquartile Range (IQR) | 6.8% | 7.7% |
| Standard Deviation (Sample) | 4.1% | 6.2% |
| Standard Deviation (Population) | 4.1% | 6.2% |
Similar Demographics by Master's Degree
Demographics Similar to Hispanics or Latinos by Master's Degree
In terms of master's degree, the demographic groups most similar to Hispanics or Latinos are Apache (11.0%, a difference of 0.34%), Cajun (11.0%, a difference of 0.35%), Hopi (10.9%, a difference of 0.54%), Immigrants from Cuba (10.9%, a difference of 0.67%), and Yaqui (11.0%, a difference of 0.74%).
| Demographics | Rating | Rank | Master's Degree |
| Puget Sound Salish | 0.0 /100 | #309 | Tragic 11.1% |
| Shoshone | 0.0 /100 | #310 | Tragic 11.1% |
| Seminole | 0.0 /100 | #311 | Tragic 11.0% |
| Choctaw | 0.0 /100 | #312 | Tragic 11.0% |
| Yaqui | 0.0 /100 | #313 | Tragic 11.0% |
| Cajuns | 0.0 /100 | #314 | Tragic 11.0% |
| Apache | 0.0 /100 | #315 | Tragic 11.0% |
| Hispanics or Latinos | 0.0 /100 | #316 | Tragic 10.9% |
| Hopi | 0.0 /100 | #317 | Tragic 10.9% |
| Immigrants | Cuba | 0.0 /100 | #318 | Tragic 10.9% |
| Kiowa | 0.0 /100 | #319 | Tragic 10.8% |
| Immigrants | Micronesia | 0.0 /100 | #320 | Tragic 10.8% |
| Pennsylvania Germans | 0.0 /100 | #321 | Tragic 10.7% |
| Sioux | 0.0 /100 | #322 | Tragic 10.7% |
| Crow | 0.0 /100 | #323 | Tragic 10.6% |
Demographics Similar to Iraqis by Master's Degree
In terms of master's degree, the demographic groups most similar to Iraqis are Slavic (15.5%, a difference of 0.050%), Icelander (15.5%, a difference of 0.080%), Slovene (15.5%, a difference of 0.12%), Immigrants from Senegal (15.5%, a difference of 0.16%), and Ghanaian (15.5%, a difference of 0.16%).
| Demographics | Rating | Rank | Master's Degree |
| Canadians | 83.3 /100 | #144 | Excellent 15.7% |
| South Americans | 81.3 /100 | #145 | Excellent 15.6% |
| Immigrants | Afghanistan | 79.4 /100 | #146 | Good 15.6% |
| Hungarians | 79.1 /100 | #147 | Good 15.6% |
| Immigrants | Senegal | 78.2 /100 | #148 | Good 15.5% |
| Ghanaians | 78.2 /100 | #149 | Good 15.5% |
| Slovenes | 78.0 /100 | #150 | Good 15.5% |
| Iraqis | 77.3 /100 | #151 | Good 15.5% |
| Slavs | 77.0 /100 | #152 | Good 15.5% |
| Icelanders | 76.8 /100 | #153 | Good 15.5% |
| Immigrants | South America | 76.3 /100 | #154 | Good 15.5% |
| Immigrants | Bangladesh | 76.1 /100 | #155 | Good 15.5% |
| Bermudans | 73.9 /100 | #156 | Good 15.4% |
| Immigrants | Cameroon | 71.7 /100 | #157 | Good 15.4% |
| Immigrants | Poland | 71.5 /100 | #158 | Good 15.4% |