Hispanic or Latino vs Irish Master's Degree
COMPARE
Hispanic or Latino
Irish
Master's Degree
Master's Degree Comparison
Hispanics or Latinos
Irish
10.9%
MASTER'S DEGREE
0.0/ 100
METRIC RATING
316th/ 347
METRIC RANK
15.0%
MASTER'S DEGREE
56.3/ 100
METRIC RATING
170th/ 347
METRIC RANK
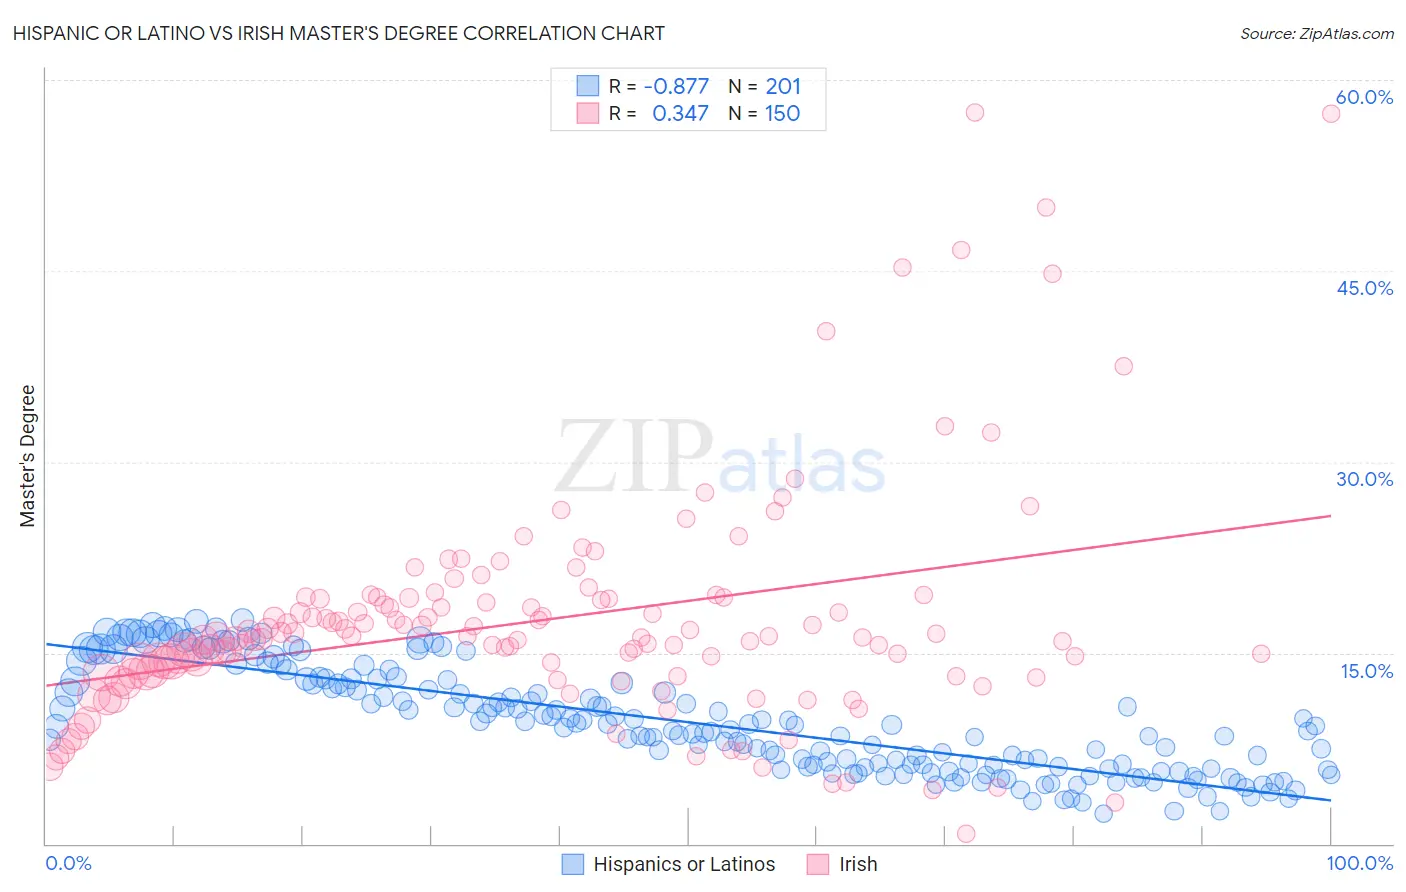
Hispanic or Latino vs Irish Master's Degree Correlation Chart
The statistical analysis conducted on geographies consisting of 577,228,232 people shows a very strong negative correlation between the proportion of Hispanics or Latinos and percentage of population with at least master's degree education in the United States with a correlation coefficient (R) of -0.877 and weighted average of 10.9%. Similarly, the statistical analysis conducted on geographies consisting of 579,087,481 people shows a mild positive correlation between the proportion of Irish and percentage of population with at least master's degree education in the United States with a correlation coefficient (R) of 0.347 and weighted average of 15.0%, a difference of 37.6%.
Master's Degree Correlation Summary
| Measurement | Hispanic or Latino | Irish |
| Minimum | 2.4% | 0.78% |
| Maximum | 17.6% | 57.5% |
| Range | 15.2% | 56.7% |
| Mean | 9.5% | 17.6% |
| Median | 9.2% | 16.3% |
| Interquartile 25% (IQ1) | 5.9% | 13.4% |
| Interquartile 75% (IQ3) | 12.7% | 19.3% |
| Interquartile Range (IQR) | 6.8% | 5.9% |
| Standard Deviation (Sample) | 4.1% | 9.0% |
| Standard Deviation (Population) | 4.1% | 9.0% |
Similar Demographics by Master's Degree
Demographics Similar to Hispanics or Latinos by Master's Degree
In terms of master's degree, the demographic groups most similar to Hispanics or Latinos are Apache (11.0%, a difference of 0.34%), Cajun (11.0%, a difference of 0.35%), Hopi (10.9%, a difference of 0.54%), Immigrants from Cuba (10.9%, a difference of 0.67%), and Yaqui (11.0%, a difference of 0.74%).
| Demographics | Rating | Rank | Master's Degree |
| Puget Sound Salish | 0.0 /100 | #309 | Tragic 11.1% |
| Shoshone | 0.0 /100 | #310 | Tragic 11.1% |
| Seminole | 0.0 /100 | #311 | Tragic 11.0% |
| Choctaw | 0.0 /100 | #312 | Tragic 11.0% |
| Yaqui | 0.0 /100 | #313 | Tragic 11.0% |
| Cajuns | 0.0 /100 | #314 | Tragic 11.0% |
| Apache | 0.0 /100 | #315 | Tragic 11.0% |
| Hispanics or Latinos | 0.0 /100 | #316 | Tragic 10.9% |
| Hopi | 0.0 /100 | #317 | Tragic 10.9% |
| Immigrants | Cuba | 0.0 /100 | #318 | Tragic 10.9% |
| Kiowa | 0.0 /100 | #319 | Tragic 10.8% |
| Immigrants | Micronesia | 0.0 /100 | #320 | Tragic 10.8% |
| Pennsylvania Germans | 0.0 /100 | #321 | Tragic 10.7% |
| Sioux | 0.0 /100 | #322 | Tragic 10.7% |
| Crow | 0.0 /100 | #323 | Tragic 10.6% |
Demographics Similar to Irish by Master's Degree
In terms of master's degree, the demographic groups most similar to Irish are Immigrants from Ghana (15.0%, a difference of 0.35%), Immigrants from Uruguay (15.0%, a difference of 0.46%), Costa Rican (15.0%, a difference of 0.50%), Slovak (14.9%, a difference of 0.81%), and Scottish (15.2%, a difference of 0.84%).
| Demographics | Rating | Rank | Master's Degree |
| Uruguayans | 67.1 /100 | #163 | Good 15.3% |
| Colombians | 66.9 /100 | #164 | Good 15.3% |
| Immigrants | Kenya | 66.6 /100 | #165 | Good 15.3% |
| Swedes | 66.1 /100 | #166 | Good 15.2% |
| Senegalese | 65.6 /100 | #167 | Good 15.2% |
| Immigrants | North Macedonia | 64.5 /100 | #168 | Good 15.2% |
| Scottish | 62.7 /100 | #169 | Good 15.2% |
| Irish | 56.3 /100 | #170 | Average 15.0% |
| Immigrants | Ghana | 53.6 /100 | #171 | Average 15.0% |
| Immigrants | Uruguay | 52.8 /100 | #172 | Average 15.0% |
| Costa Ricans | 52.5 /100 | #173 | Average 15.0% |
| Slovaks | 50.0 /100 | #174 | Average 14.9% |
| Immigrants | Peru | 49.6 /100 | #175 | Average 14.9% |
| Nigerians | 48.6 /100 | #176 | Average 14.9% |
| Immigrants | Colombia | 48.3 /100 | #177 | Average 14.9% |