Immigrants from South Central Asia vs Iraqi Master's Degree
COMPARE
Immigrants from South Central Asia
Iraqi
Master's Degree
Master's Degree Comparison
Immigrants from South Central Asia
Iraqis
20.7%
MASTER'S DEGREE
100.0/ 100
METRIC RATING
17th/ 347
METRIC RANK
15.5%
MASTER'S DEGREE
77.3/ 100
METRIC RATING
151st/ 347
METRIC RANK
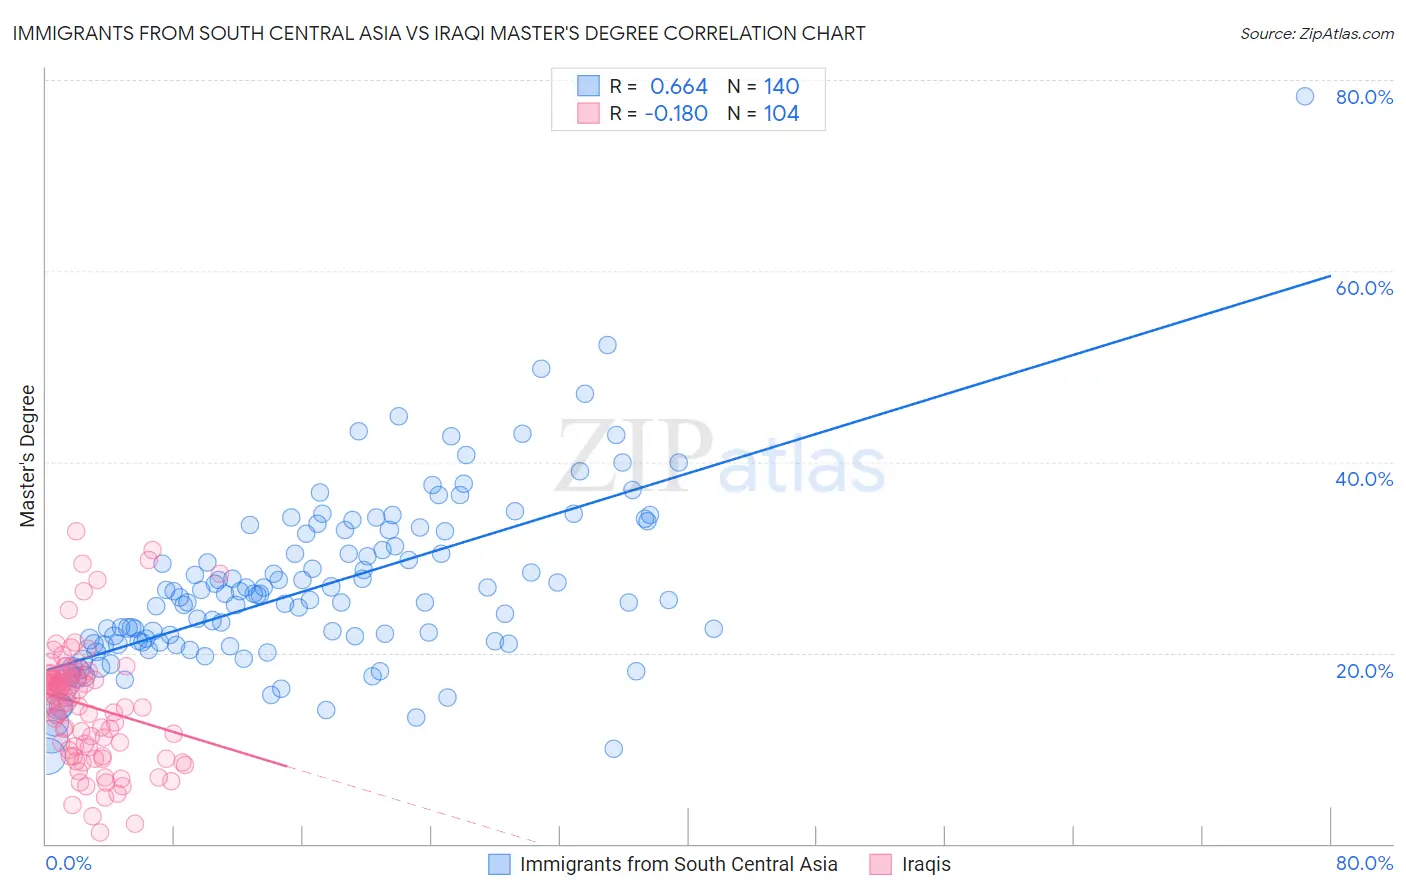
Immigrants from South Central Asia vs Iraqi Master's Degree Correlation Chart
The statistical analysis conducted on geographies consisting of 472,904,937 people shows a significant positive correlation between the proportion of Immigrants from South Central Asia and percentage of population with at least master's degree education in the United States with a correlation coefficient (R) of 0.664 and weighted average of 20.7%. Similarly, the statistical analysis conducted on geographies consisting of 170,638,714 people shows a poor negative correlation between the proportion of Iraqis and percentage of population with at least master's degree education in the United States with a correlation coefficient (R) of -0.180 and weighted average of 15.5%, a difference of 33.6%.
Master's Degree Correlation Summary
| Measurement | Immigrants from South Central Asia | Iraqi |
| Minimum | 9.1% | 1.1% |
| Maximum | 78.4% | 32.7% |
| Range | 69.2% | 31.5% |
| Mean | 26.9% | 14.5% |
| Median | 25.6% | 15.2% |
| Interquartile 25% (IQ1) | 21.0% | 9.9% |
| Interquartile 75% (IQ3) | 32.6% | 17.6% |
| Interquartile Range (IQR) | 11.6% | 7.7% |
| Standard Deviation (Sample) | 9.3% | 6.2% |
| Standard Deviation (Population) | 9.3% | 6.2% |
Similar Demographics by Master's Degree
Demographics Similar to Immigrants from South Central Asia by Master's Degree
In terms of master's degree, the demographic groups most similar to Immigrants from South Central Asia are Immigrants from Belgium (20.8%, a difference of 0.26%), Immigrants from Eastern Asia (20.8%, a difference of 0.54%), Immigrants from Switzerland (20.9%, a difference of 0.73%), Immigrants from Australia (20.9%, a difference of 0.74%), and Soviet Union (20.5%, a difference of 0.92%).
| Demographics | Rating | Rank | Master's Degree |
| Immigrants | Iran | 100.0 /100 | #10 | Exceptional 21.6% |
| Immigrants | China | 100.0 /100 | #11 | Exceptional 21.2% |
| Eastern Europeans | 100.0 /100 | #12 | Exceptional 21.1% |
| Immigrants | Australia | 100.0 /100 | #13 | Exceptional 20.9% |
| Immigrants | Switzerland | 100.0 /100 | #14 | Exceptional 20.9% |
| Immigrants | Eastern Asia | 100.0 /100 | #15 | Exceptional 20.8% |
| Immigrants | Belgium | 100.0 /100 | #16 | Exceptional 20.8% |
| Immigrants | South Central Asia | 100.0 /100 | #17 | Exceptional 20.7% |
| Soviet Union | 100.0 /100 | #18 | Exceptional 20.5% |
| Immigrants | Hong Kong | 100.0 /100 | #19 | Exceptional 20.5% |
| Indians (Asian) | 100.0 /100 | #20 | Exceptional 20.5% |
| Immigrants | Ireland | 100.0 /100 | #21 | Exceptional 20.4% |
| Israelis | 100.0 /100 | #22 | Exceptional 20.3% |
| Immigrants | France | 100.0 /100 | #23 | Exceptional 20.3% |
| Immigrants | Sweden | 100.0 /100 | #24 | Exceptional 20.3% |
Demographics Similar to Iraqis by Master's Degree
In terms of master's degree, the demographic groups most similar to Iraqis are Slavic (15.5%, a difference of 0.050%), Icelander (15.5%, a difference of 0.080%), Slovene (15.5%, a difference of 0.12%), Immigrants from Senegal (15.5%, a difference of 0.16%), and Ghanaian (15.5%, a difference of 0.16%).
| Demographics | Rating | Rank | Master's Degree |
| Canadians | 83.3 /100 | #144 | Excellent 15.7% |
| South Americans | 81.3 /100 | #145 | Excellent 15.6% |
| Immigrants | Afghanistan | 79.4 /100 | #146 | Good 15.6% |
| Hungarians | 79.1 /100 | #147 | Good 15.6% |
| Immigrants | Senegal | 78.2 /100 | #148 | Good 15.5% |
| Ghanaians | 78.2 /100 | #149 | Good 15.5% |
| Slovenes | 78.0 /100 | #150 | Good 15.5% |
| Iraqis | 77.3 /100 | #151 | Good 15.5% |
| Slavs | 77.0 /100 | #152 | Good 15.5% |
| Icelanders | 76.8 /100 | #153 | Good 15.5% |
| Immigrants | South America | 76.3 /100 | #154 | Good 15.5% |
| Immigrants | Bangladesh | 76.1 /100 | #155 | Good 15.5% |
| Bermudans | 73.9 /100 | #156 | Good 15.4% |
| Immigrants | Cameroon | 71.7 /100 | #157 | Good 15.4% |
| Immigrants | Poland | 71.5 /100 | #158 | Good 15.4% |