Hawaiian vs Immigrants from Peru Associate's Degree
COMPARE
Hawaiian
Immigrants from Peru
Associate's Degree
Associate's Degree Comparison
Hawaiians
Immigrants from Peru
40.9%
ASSOCIATE'S DEGREE
0.2/ 100
METRIC RATING
267th/ 347
METRIC RANK
45.5%
ASSOCIATE'S DEGREE
27.6/ 100
METRIC RATING
194th/ 347
METRIC RANK
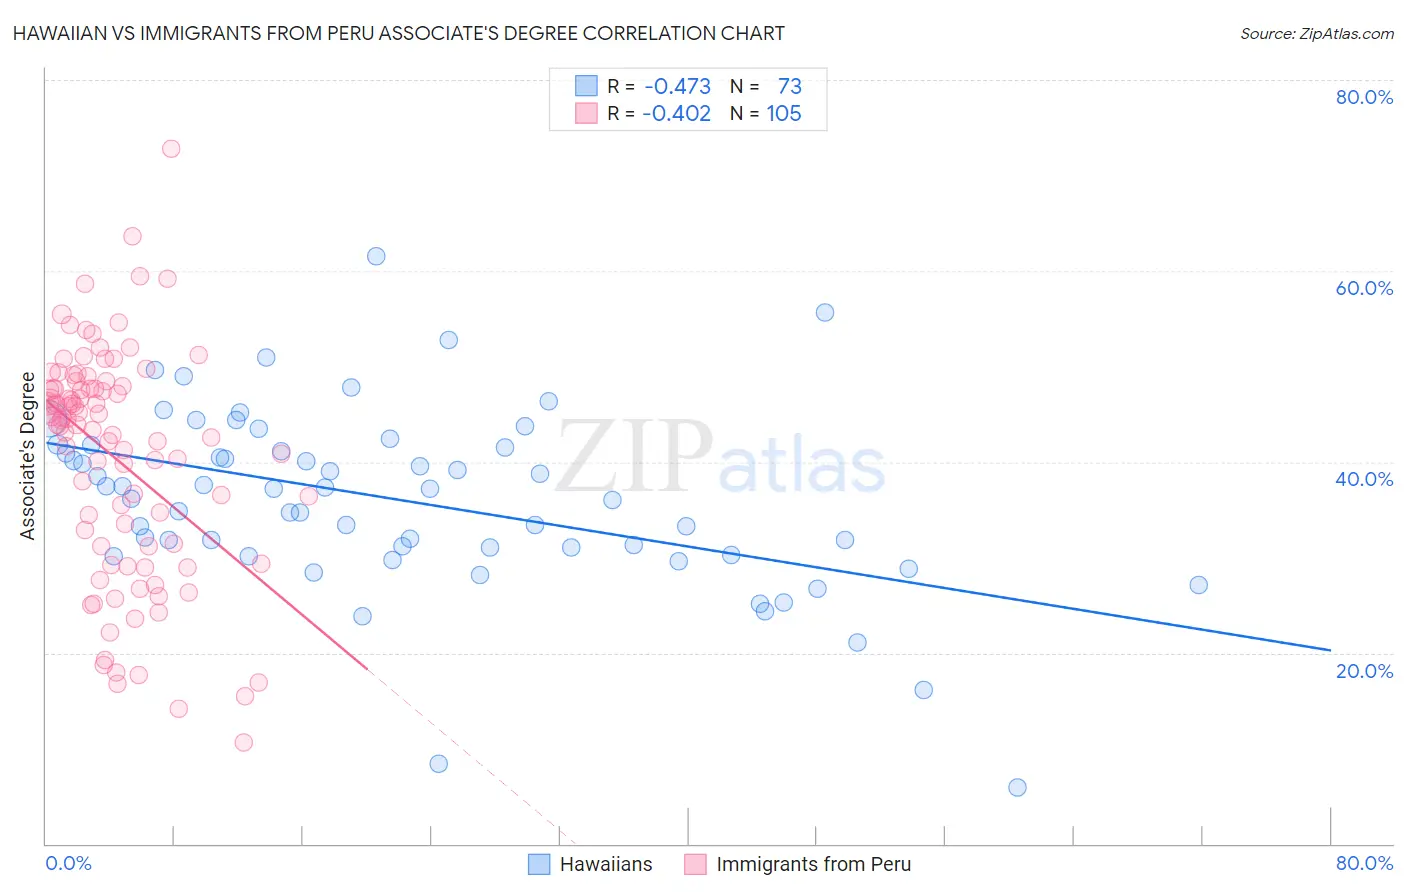
Hawaiian vs Immigrants from Peru Associate's Degree Correlation Chart
The statistical analysis conducted on geographies consisting of 327,594,754 people shows a moderate negative correlation between the proportion of Hawaiians and percentage of population with at least associate's degree education in the United States with a correlation coefficient (R) of -0.473 and weighted average of 40.9%. Similarly, the statistical analysis conducted on geographies consisting of 328,856,641 people shows a moderate negative correlation between the proportion of Immigrants from Peru and percentage of population with at least associate's degree education in the United States with a correlation coefficient (R) of -0.402 and weighted average of 45.5%, a difference of 11.3%.
Associate's Degree Correlation Summary
| Measurement | Hawaiian | Immigrants from Peru |
| Minimum | 5.9% | 10.6% |
| Maximum | 61.5% | 72.7% |
| Range | 55.7% | 62.1% |
| Mean | 36.0% | 40.4% |
| Median | 37.2% | 43.8% |
| Interquartile 25% (IQ1) | 30.6% | 31.2% |
| Interquartile 75% (IQ3) | 41.7% | 47.8% |
| Interquartile Range (IQR) | 11.0% | 16.6% |
| Standard Deviation (Sample) | 9.5% | 12.0% |
| Standard Deviation (Population) | 9.4% | 11.9% |
Similar Demographics by Associate's Degree
Demographics Similar to Hawaiians by Associate's Degree
In terms of associate's degree, the demographic groups most similar to Hawaiians are Central American Indian (40.8%, a difference of 0.20%), American (40.8%, a difference of 0.38%), Chippewa (40.7%, a difference of 0.42%), African (41.1%, a difference of 0.56%), and Samoan (41.1%, a difference of 0.56%).
| Demographics | Rating | Rank | Associate's Degree |
| Marshallese | 0.4 /100 | #260 | Tragic 41.6% |
| Nicaraguans | 0.4 /100 | #261 | Tragic 41.5% |
| Bahamians | 0.4 /100 | #262 | Tragic 41.5% |
| Immigrants | Jamaica | 0.3 /100 | #263 | Tragic 41.5% |
| Osage | 0.3 /100 | #264 | Tragic 41.5% |
| Africans | 0.2 /100 | #265 | Tragic 41.1% |
| Samoans | 0.2 /100 | #266 | Tragic 41.1% |
| Hawaiians | 0.2 /100 | #267 | Tragic 40.9% |
| Central American Indians | 0.2 /100 | #268 | Tragic 40.8% |
| Americans | 0.2 /100 | #269 | Tragic 40.8% |
| Chippewa | 0.2 /100 | #270 | Tragic 40.7% |
| Immigrants | Laos | 0.1 /100 | #271 | Tragic 40.7% |
| Belizeans | 0.1 /100 | #272 | Tragic 40.6% |
| Puget Sound Salish | 0.1 /100 | #273 | Tragic 40.5% |
| Immigrants | Dominica | 0.1 /100 | #274 | Tragic 40.5% |
Demographics Similar to Immigrants from Peru by Associate's Degree
In terms of associate's degree, the demographic groups most similar to Immigrants from Peru are German (45.5%, a difference of 0.10%), French (45.4%, a difference of 0.19%), Immigrants from Cameroon (45.7%, a difference of 0.32%), Celtic (45.8%, a difference of 0.51%), and Scotch-Irish (45.3%, a difference of 0.54%).
| Demographics | Rating | Rank | Associate's Degree |
| Immigrants | Uruguay | 35.5 /100 | #187 | Fair 45.8% |
| Ghanaians | 35.5 /100 | #188 | Fair 45.8% |
| Immigrants | Oceania | 34.7 /100 | #189 | Fair 45.8% |
| Vietnamese | 34.0 /100 | #190 | Fair 45.8% |
| Koreans | 33.8 /100 | #191 | Fair 45.8% |
| Celtics | 33.3 /100 | #192 | Fair 45.8% |
| Immigrants | Cameroon | 31.0 /100 | #193 | Fair 45.7% |
| Immigrants | Peru | 27.6 /100 | #194 | Fair 45.5% |
| Germans | 26.5 /100 | #195 | Fair 45.5% |
| French | 25.6 /100 | #196 | Fair 45.4% |
| Scotch-Irish | 22.3 /100 | #197 | Fair 45.3% |
| Immigrants | Bangladesh | 21.3 /100 | #198 | Fair 45.2% |
| Immigrants | Senegal | 21.2 /100 | #199 | Fair 45.2% |
| Senegalese | 21.1 /100 | #200 | Fair 45.2% |
| Immigrants | Vietnam | 20.8 /100 | #201 | Fair 45.2% |