Hawaiian vs Guamanian/Chamorro Associate's Degree
COMPARE
Hawaiian
Guamanian/Chamorro
Associate's Degree
Associate's Degree Comparison
Hawaiians
Guamanians/Chamorros
40.9%
ASSOCIATE'S DEGREE
0.2/ 100
METRIC RATING
267th/ 347
METRIC RANK
43.8%
ASSOCIATE'S DEGREE
4.8/ 100
METRIC RATING
225th/ 347
METRIC RANK
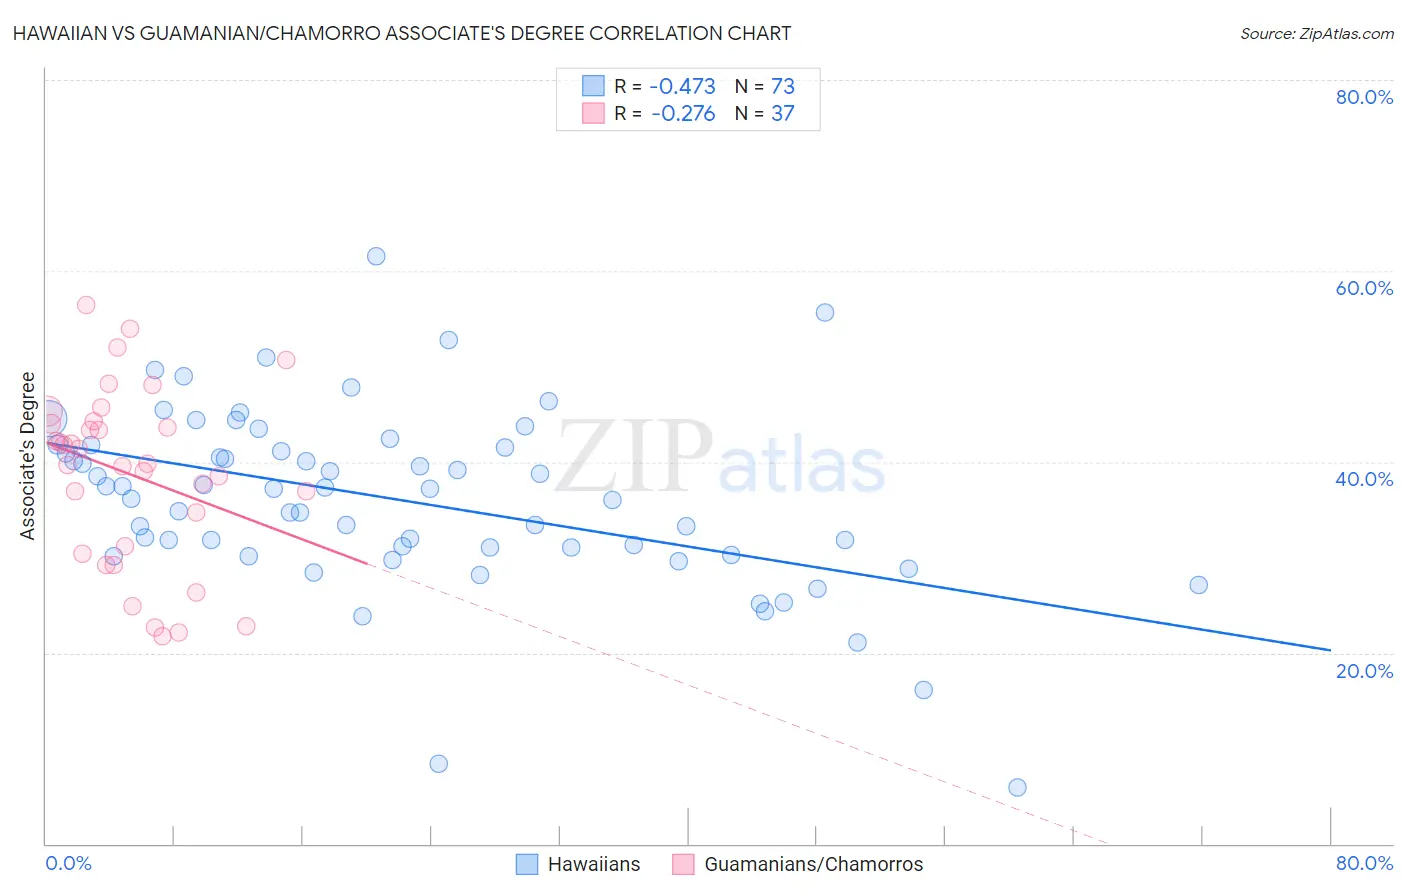
Hawaiian vs Guamanian/Chamorro Associate's Degree Correlation Chart
The statistical analysis conducted on geographies consisting of 327,594,754 people shows a moderate negative correlation between the proportion of Hawaiians and percentage of population with at least associate's degree education in the United States with a correlation coefficient (R) of -0.473 and weighted average of 40.9%. Similarly, the statistical analysis conducted on geographies consisting of 221,965,027 people shows a weak negative correlation between the proportion of Guamanians/Chamorros and percentage of population with at least associate's degree education in the United States with a correlation coefficient (R) of -0.276 and weighted average of 43.8%, a difference of 7.0%.
Associate's Degree Correlation Summary
| Measurement | Hawaiian | Guamanian/Chamorro |
| Minimum | 5.9% | 21.7% |
| Maximum | 61.5% | 56.4% |
| Range | 55.7% | 34.7% |
| Mean | 36.0% | 38.7% |
| Median | 37.2% | 39.8% |
| Interquartile 25% (IQ1) | 30.6% | 30.8% |
| Interquartile 75% (IQ3) | 41.7% | 44.1% |
| Interquartile Range (IQR) | 11.0% | 13.4% |
| Standard Deviation (Sample) | 9.5% | 9.2% |
| Standard Deviation (Population) | 9.4% | 9.1% |
Similar Demographics by Associate's Degree
Demographics Similar to Hawaiians by Associate's Degree
In terms of associate's degree, the demographic groups most similar to Hawaiians are Central American Indian (40.8%, a difference of 0.20%), American (40.8%, a difference of 0.38%), Chippewa (40.7%, a difference of 0.42%), African (41.1%, a difference of 0.56%), and Samoan (41.1%, a difference of 0.56%).
| Demographics | Rating | Rank | Associate's Degree |
| Marshallese | 0.4 /100 | #260 | Tragic 41.6% |
| Nicaraguans | 0.4 /100 | #261 | Tragic 41.5% |
| Bahamians | 0.4 /100 | #262 | Tragic 41.5% |
| Immigrants | Jamaica | 0.3 /100 | #263 | Tragic 41.5% |
| Osage | 0.3 /100 | #264 | Tragic 41.5% |
| Africans | 0.2 /100 | #265 | Tragic 41.1% |
| Samoans | 0.2 /100 | #266 | Tragic 41.1% |
| Hawaiians | 0.2 /100 | #267 | Tragic 40.9% |
| Central American Indians | 0.2 /100 | #268 | Tragic 40.8% |
| Americans | 0.2 /100 | #269 | Tragic 40.8% |
| Chippewa | 0.2 /100 | #270 | Tragic 40.7% |
| Immigrants | Laos | 0.1 /100 | #271 | Tragic 40.7% |
| Belizeans | 0.1 /100 | #272 | Tragic 40.6% |
| Puget Sound Salish | 0.1 /100 | #273 | Tragic 40.5% |
| Immigrants | Dominica | 0.1 /100 | #274 | Tragic 40.5% |
Demographics Similar to Guamanians/Chamorros by Associate's Degree
In terms of associate's degree, the demographic groups most similar to Guamanians/Chamorros are West Indian (43.8%, a difference of 0.15%), Immigrants from Burma/Myanmar (43.7%, a difference of 0.22%), Subsaharan African (43.9%, a difference of 0.29%), Barbadian (43.9%, a difference of 0.39%), and Trinidadian and Tobagonian (43.6%, a difference of 0.39%).
| Demographics | Rating | Rank | Associate's Degree |
| Spanish | 9.4 /100 | #218 | Tragic 44.4% |
| Whites/Caucasians | 7.5 /100 | #219 | Tragic 44.2% |
| Portuguese | 7.2 /100 | #220 | Tragic 44.1% |
| Immigrants | Western Africa | 6.6 /100 | #221 | Tragic 44.1% |
| Barbadians | 5.8 /100 | #222 | Tragic 43.9% |
| Sub-Saharan Africans | 5.5 /100 | #223 | Tragic 43.9% |
| West Indians | 5.2 /100 | #224 | Tragic 43.8% |
| Guamanians/Chamorros | 4.8 /100 | #225 | Tragic 43.8% |
| Immigrants | Burma/Myanmar | 4.3 /100 | #226 | Tragic 43.7% |
| Trinidadians and Tobagonians | 4.0 /100 | #227 | Tragic 43.6% |
| Hmong | 3.2 /100 | #228 | Tragic 43.4% |
| Immigrants | Trinidad and Tobago | 3.0 /100 | #229 | Tragic 43.3% |
| Immigrants | Barbados | 2.9 /100 | #230 | Tragic 43.3% |
| Liberians | 2.9 /100 | #231 | Tragic 43.3% |
| Native Hawaiians | 2.3 /100 | #232 | Tragic 43.1% |