Immigrants vs Immigrants from Peru Associate's Degree
COMPARE
Immigrants
Immigrants from Peru
Associate's Degree
Associate's Degree Comparison
Immigrants
Immigrants from Peru
44.5%
ASSOCIATE'S DEGREE
10.5/ 100
METRIC RATING
217th/ 347
METRIC RANK
45.5%
ASSOCIATE'S DEGREE
27.6/ 100
METRIC RATING
194th/ 347
METRIC RANK
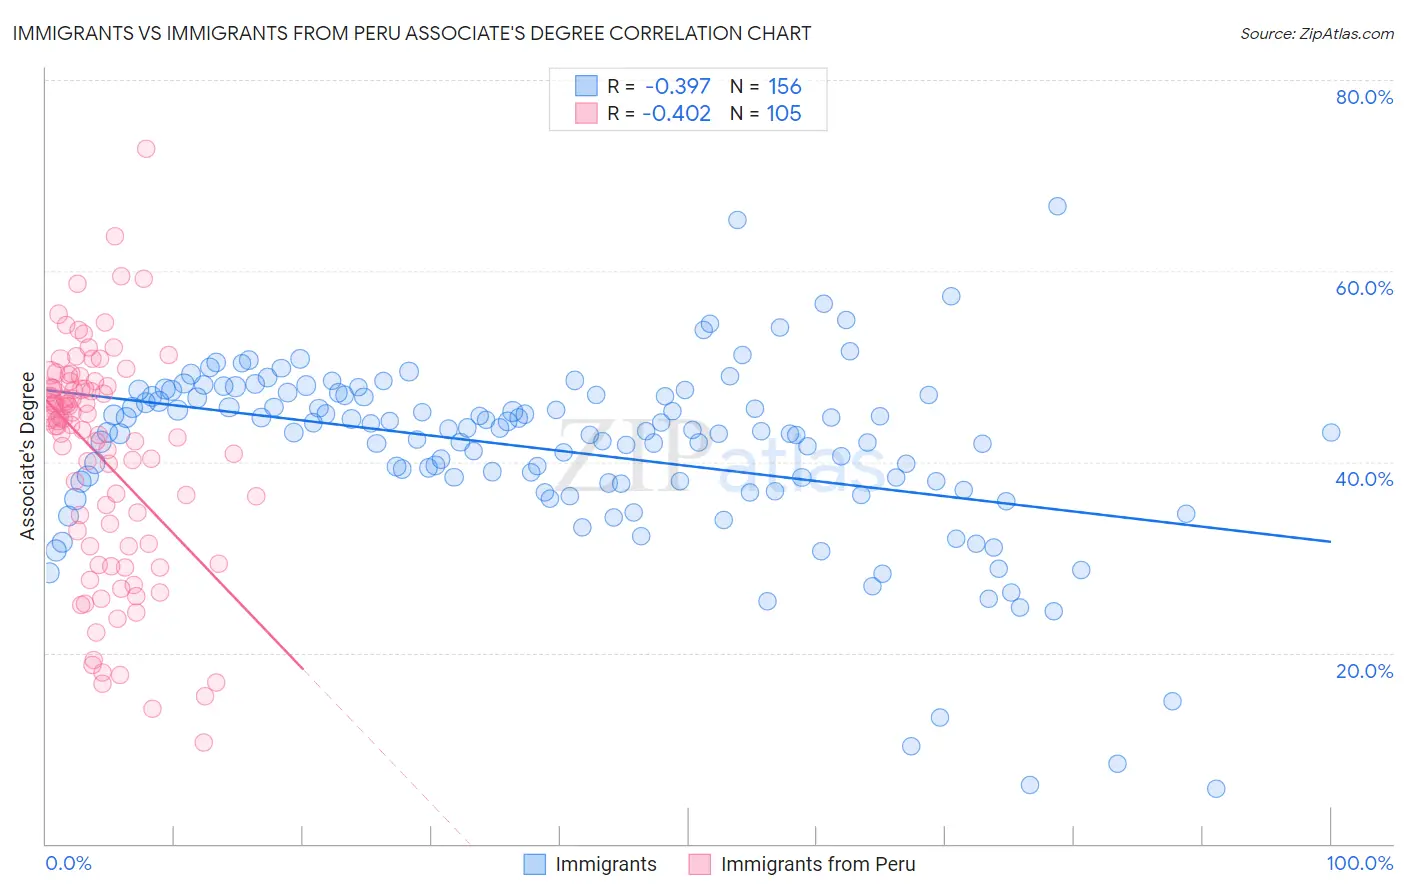
Immigrants vs Immigrants from Peru Associate's Degree Correlation Chart
The statistical analysis conducted on geographies consisting of 577,638,441 people shows a mild negative correlation between the proportion of Immigrants and percentage of population with at least associate's degree education in the United States with a correlation coefficient (R) of -0.397 and weighted average of 44.5%. Similarly, the statistical analysis conducted on geographies consisting of 328,856,641 people shows a moderate negative correlation between the proportion of Immigrants from Peru and percentage of population with at least associate's degree education in the United States with a correlation coefficient (R) of -0.402 and weighted average of 45.5%, a difference of 2.3%.
Associate's Degree Correlation Summary
| Measurement | Immigrants | Immigrants from Peru |
| Minimum | 5.7% | 10.6% |
| Maximum | 66.8% | 72.7% |
| Range | 61.1% | 62.1% |
| Mean | 41.2% | 40.4% |
| Median | 43.1% | 43.8% |
| Interquartile 25% (IQ1) | 37.8% | 31.2% |
| Interquartile 75% (IQ3) | 46.9% | 47.8% |
| Interquartile Range (IQR) | 9.1% | 16.6% |
| Standard Deviation (Sample) | 9.6% | 12.0% |
| Standard Deviation (Population) | 9.5% | 11.9% |
Similar Demographics by Associate's Degree
Demographics Similar to Immigrants by Associate's Degree
In terms of associate's degree, the demographic groups most similar to Immigrants are Immigrants from Nigeria (44.6%, a difference of 0.19%), Spanish (44.4%, a difference of 0.25%), Immigrants from Panama (44.7%, a difference of 0.37%), Immigrants from Middle Africa (44.7%, a difference of 0.42%), and Immigrants from Ghana (44.8%, a difference of 0.68%).
| Demographics | Rating | Rank | Associate's Degree |
| Immigrants | Philippines | 16.7 /100 | #210 | Poor 45.0% |
| Immigrants | Zaire | 16.6 /100 | #211 | Poor 45.0% |
| French Canadians | 15.0 /100 | #212 | Poor 44.9% |
| Immigrants | Ghana | 14.2 /100 | #213 | Poor 44.8% |
| Immigrants | Middle Africa | 12.7 /100 | #214 | Poor 44.7% |
| Immigrants | Panama | 12.4 /100 | #215 | Poor 44.7% |
| Immigrants | Nigeria | 11.4 /100 | #216 | Poor 44.6% |
| Immigrants | Immigrants | 10.5 /100 | #217 | Poor 44.5% |
| Spanish | 9.4 /100 | #218 | Tragic 44.4% |
| Whites/Caucasians | 7.5 /100 | #219 | Tragic 44.2% |
| Portuguese | 7.2 /100 | #220 | Tragic 44.1% |
| Immigrants | Western Africa | 6.6 /100 | #221 | Tragic 44.1% |
| Barbadians | 5.8 /100 | #222 | Tragic 43.9% |
| Sub-Saharan Africans | 5.5 /100 | #223 | Tragic 43.9% |
| West Indians | 5.2 /100 | #224 | Tragic 43.8% |
Demographics Similar to Immigrants from Peru by Associate's Degree
In terms of associate's degree, the demographic groups most similar to Immigrants from Peru are German (45.5%, a difference of 0.10%), French (45.4%, a difference of 0.19%), Immigrants from Cameroon (45.7%, a difference of 0.32%), Celtic (45.8%, a difference of 0.51%), and Scotch-Irish (45.3%, a difference of 0.54%).
| Demographics | Rating | Rank | Associate's Degree |
| Immigrants | Uruguay | 35.5 /100 | #187 | Fair 45.8% |
| Ghanaians | 35.5 /100 | #188 | Fair 45.8% |
| Immigrants | Oceania | 34.7 /100 | #189 | Fair 45.8% |
| Vietnamese | 34.0 /100 | #190 | Fair 45.8% |
| Koreans | 33.8 /100 | #191 | Fair 45.8% |
| Celtics | 33.3 /100 | #192 | Fair 45.8% |
| Immigrants | Cameroon | 31.0 /100 | #193 | Fair 45.7% |
| Immigrants | Peru | 27.6 /100 | #194 | Fair 45.5% |
| Germans | 26.5 /100 | #195 | Fair 45.5% |
| French | 25.6 /100 | #196 | Fair 45.4% |
| Scotch-Irish | 22.3 /100 | #197 | Fair 45.3% |
| Immigrants | Bangladesh | 21.3 /100 | #198 | Fair 45.2% |
| Immigrants | Senegal | 21.2 /100 | #199 | Fair 45.2% |
| Senegalese | 21.1 /100 | #200 | Fair 45.2% |
| Immigrants | Vietnam | 20.8 /100 | #201 | Fair 45.2% |