Hawaiian vs Guamanian/Chamorro Female Poverty Among 25-34 Year Olds
COMPARE
Hawaiian
Guamanian/Chamorro
Female Poverty Among 25-34 Year Olds
Female Poverty Among 25-34 Year Olds Comparison
Hawaiians
Guamanians/Chamorros
14.1%
FEMALE POVERTY AMONG 25-34 YEAR OLDS
13.6/ 100
METRIC RATING
204th/ 347
METRIC RANK
13.6%
FEMALE POVERTY AMONG 25-34 YEAR OLDS
41.5/ 100
METRIC RATING
181st/ 347
METRIC RANK
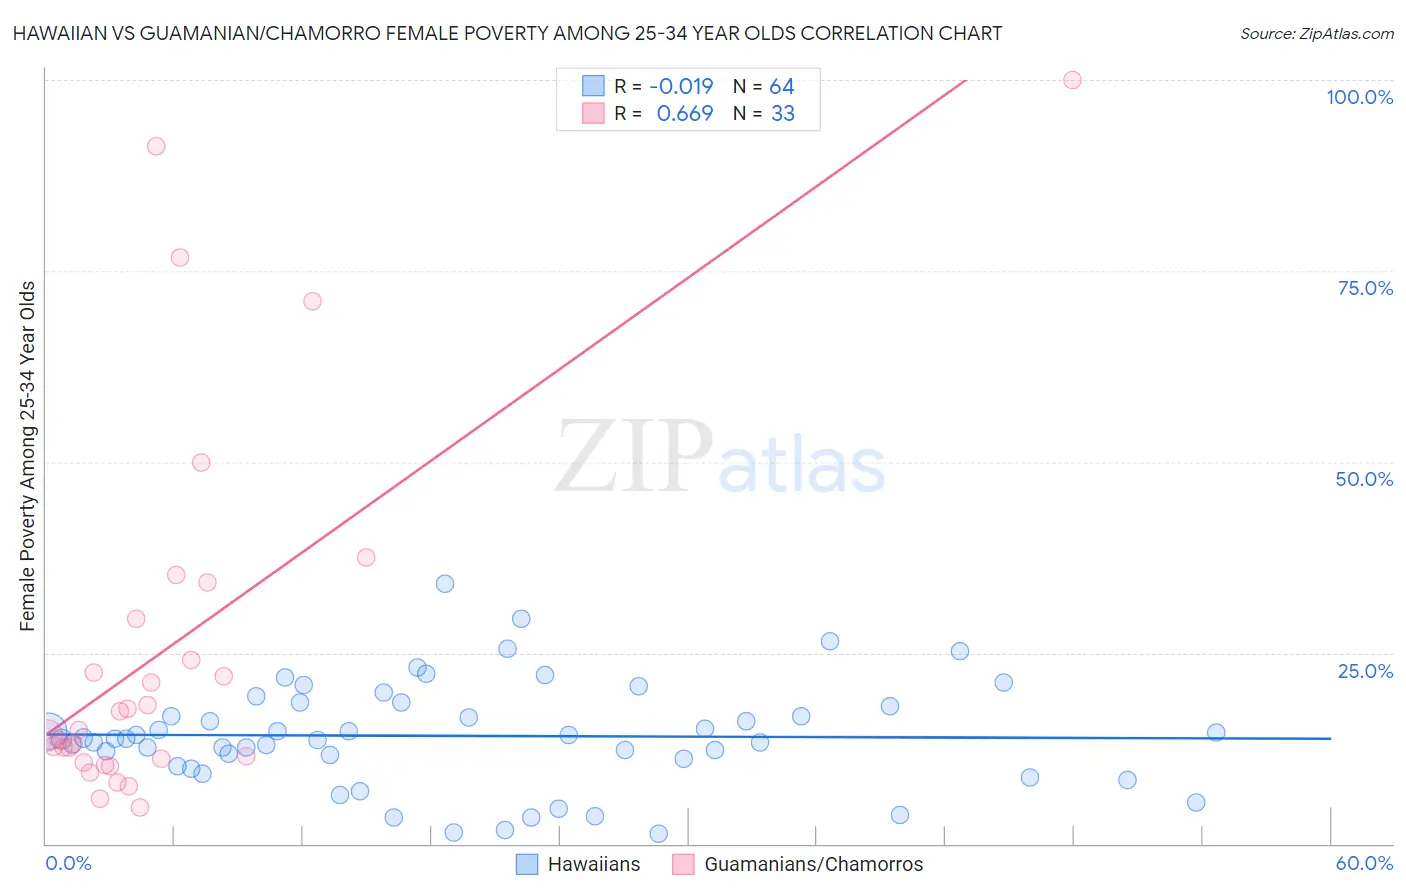
Hawaiian vs Guamanian/Chamorro Female Poverty Among 25-34 Year Olds Correlation Chart
The statistical analysis conducted on geographies consisting of 324,442,153 people shows no correlation between the proportion of Hawaiians and poverty level among females between the ages 25 and 34 in the United States with a correlation coefficient (R) of -0.019 and weighted average of 14.1%. Similarly, the statistical analysis conducted on geographies consisting of 220,375,299 people shows a significant positive correlation between the proportion of Guamanians/Chamorros and poverty level among females between the ages 25 and 34 in the United States with a correlation coefficient (R) of 0.669 and weighted average of 13.6%, a difference of 3.1%.
Female Poverty Among 25-34 Year Olds Correlation Summary
| Measurement | Hawaiian | Guamanian/Chamorro |
| Minimum | 1.2% | 4.8% |
| Maximum | 34.1% | 100.0% |
| Range | 32.8% | 95.2% |
| Mean | 14.1% | 25.8% |
| Median | 13.8% | 14.8% |
| Interquartile 25% (IQ1) | 10.7% | 10.9% |
| Interquartile 75% (IQ3) | 18.2% | 31.8% |
| Interquartile Range (IQR) | 7.5% | 20.9% |
| Standard Deviation (Sample) | 6.8% | 24.7% |
| Standard Deviation (Population) | 6.8% | 24.3% |
Similar Demographics by Female Poverty Among 25-34 Year Olds
Demographics Similar to Hawaiians by Female Poverty Among 25-34 Year Olds
In terms of female poverty among 25-34 year olds, the demographic groups most similar to Hawaiians are Immigrants from Africa (14.1%, a difference of 0.050%), Immigrants (14.0%, a difference of 0.15%), Hungarian (14.1%, a difference of 0.33%), Japanese (14.1%, a difference of 0.35%), and Immigrants from Panama (14.1%, a difference of 0.37%).
| Demographics | Rating | Rank | Female Poverty Among 25-34 Year Olds |
| Immigrants | Saudi Arabia | 21.9 /100 | #197 | Fair 13.9% |
| Immigrants | Germany | 20.9 /100 | #198 | Fair 13.9% |
| English | 20.4 /100 | #199 | Fair 13.9% |
| Hmong | 20.3 /100 | #200 | Fair 13.9% |
| Immigrants | Trinidad and Tobago | 17.6 /100 | #201 | Poor 14.0% |
| Welsh | 17.2 /100 | #202 | Poor 14.0% |
| Immigrants | Immigrants | 14.5 /100 | #203 | Poor 14.0% |
| Hawaiians | 13.6 /100 | #204 | Poor 14.1% |
| Immigrants | Africa | 13.4 /100 | #205 | Poor 14.1% |
| Hungarians | 11.8 /100 | #206 | Poor 14.1% |
| Japanese | 11.7 /100 | #207 | Poor 14.1% |
| Immigrants | Panama | 11.6 /100 | #208 | Poor 14.1% |
| Guyanese | 8.6 /100 | #209 | Tragic 14.2% |
| Panamanians | 8.6 /100 | #210 | Tragic 14.2% |
| Trinidadians and Tobagonians | 8.2 /100 | #211 | Tragic 14.2% |
Demographics Similar to Guamanians/Chamorros by Female Poverty Among 25-34 Year Olds
In terms of female poverty among 25-34 year olds, the demographic groups most similar to Guamanians/Chamorros are German (13.6%, a difference of 0.010%), Immigrants from Venezuela (13.6%, a difference of 0.070%), Portuguese (13.6%, a difference of 0.10%), Immigrants from Eastern Africa (13.6%, a difference of 0.17%), and Canadian (13.6%, a difference of 0.24%).
| Demographics | Rating | Rank | Female Poverty Among 25-34 Year Olds |
| Immigrants | Oceania | 50.0 /100 | #174 | Average 13.5% |
| Bermudans | 46.8 /100 | #175 | Average 13.6% |
| Yugoslavians | 45.0 /100 | #176 | Average 13.6% |
| Venezuelans | 44.6 /100 | #177 | Average 13.6% |
| Canadians | 44.3 /100 | #178 | Average 13.6% |
| Immigrants | Eastern Africa | 43.6 /100 | #179 | Average 13.6% |
| Germans | 41.6 /100 | #180 | Average 13.6% |
| Guamanians/Chamorros | 41.5 /100 | #181 | Average 13.6% |
| Immigrants | Venezuela | 40.7 /100 | #182 | Average 13.6% |
| Portuguese | 40.3 /100 | #183 | Average 13.6% |
| Czechoslovakians | 36.8 /100 | #184 | Fair 13.7% |
| Irish | 35.3 /100 | #185 | Fair 13.7% |
| Immigrants | Uruguay | 34.1 /100 | #186 | Fair 13.7% |
| Slovaks | 34.1 /100 | #187 | Fair 13.7% |
| Immigrants | Eritrea | 32.7 /100 | #188 | Fair 13.7% |