Haitian vs Iranian 6th Grade
COMPARE
Haitian
Iranian
6th Grade
6th Grade Comparison
Haitians
Iranians
95.8%
6TH GRADE
0.0/ 100
METRIC RATING
297th/ 347
METRIC RANK
97.6%
6TH GRADE
99.6/ 100
METRIC RATING
69th/ 347
METRIC RANK
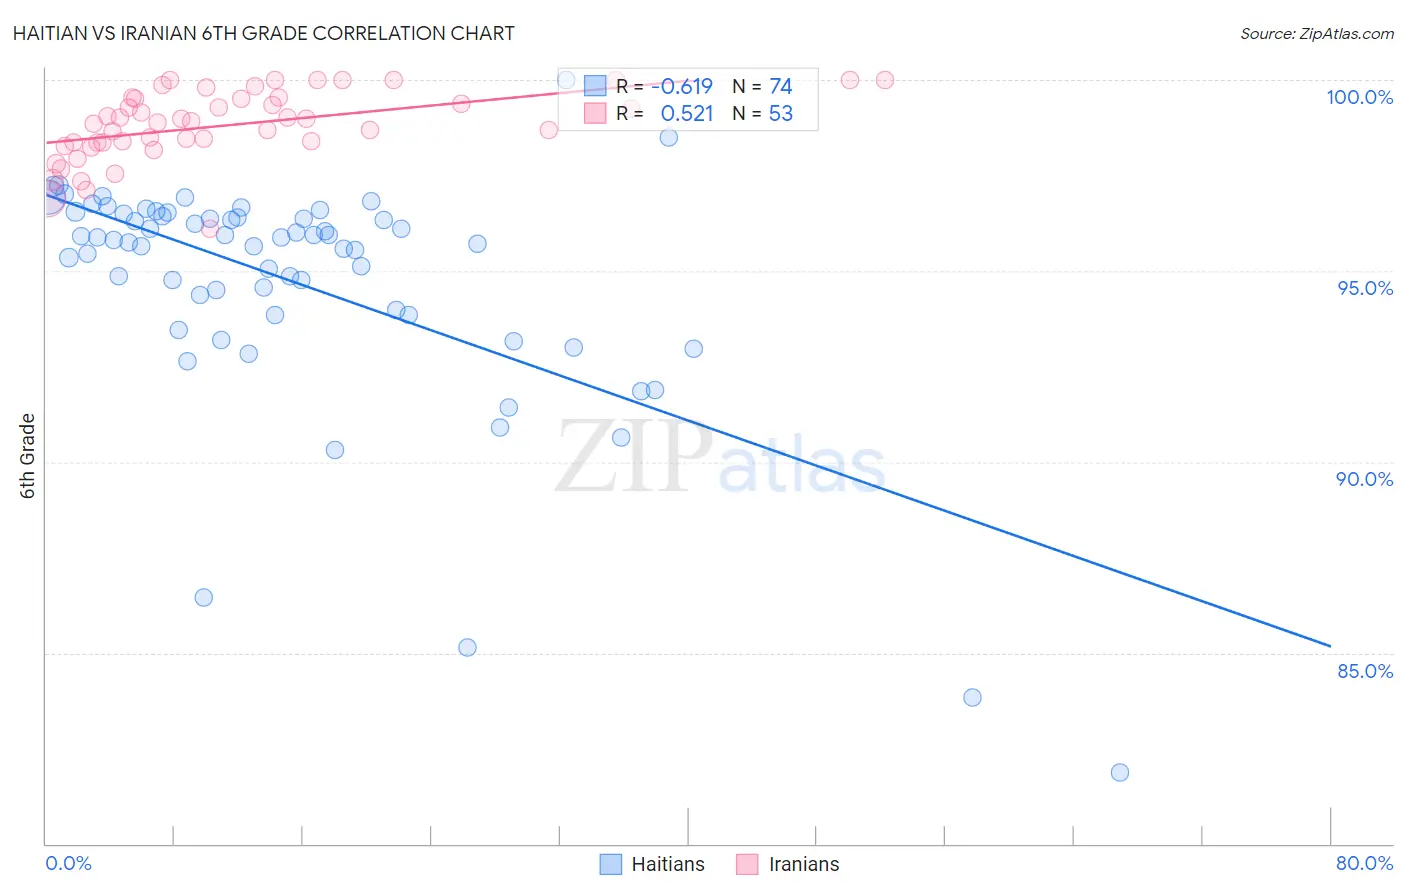
Haitian vs Iranian 6th Grade Correlation Chart
The statistical analysis conducted on geographies consisting of 288,018,742 people shows a significant negative correlation between the proportion of Haitians and percentage of population with at least 6th grade education in the United States with a correlation coefficient (R) of -0.619 and weighted average of 95.8%. Similarly, the statistical analysis conducted on geographies consisting of 310,636,461 people shows a substantial positive correlation between the proportion of Iranians and percentage of population with at least 6th grade education in the United States with a correlation coefficient (R) of 0.521 and weighted average of 97.6%, a difference of 1.9%.
6th Grade Correlation Summary
| Measurement | Haitian | Iranian |
| Minimum | 81.9% | 96.1% |
| Maximum | 100.0% | 100.0% |
| Range | 18.1% | 3.9% |
| Mean | 94.7% | 98.8% |
| Median | 95.8% | 98.9% |
| Interquartile 25% (IQ1) | 93.8% | 98.4% |
| Interquartile 75% (IQ3) | 96.4% | 99.5% |
| Interquartile Range (IQR) | 2.6% | 1.2% |
| Standard Deviation (Sample) | 3.1% | 0.91% |
| Standard Deviation (Population) | 3.1% | 0.90% |
Similar Demographics by 6th Grade
Demographics Similar to Haitians by 6th Grade
In terms of 6th grade, the demographic groups most similar to Haitians are Sri Lankan (95.8%, a difference of 0.070%), Immigrants from Laos (95.7%, a difference of 0.080%), Immigrants from Dominica (95.7%, a difference of 0.090%), Immigrants (95.7%, a difference of 0.10%), and Immigrants from South Eastern Asia (95.9%, a difference of 0.11%).
| Demographics | Rating | Rank | 6th Grade |
| Immigrants | Somalia | 0.0 /100 | #290 | Tragic 96.1% |
| Immigrants | St. Vincent and the Grenadines | 0.0 /100 | #291 | Tragic 96.1% |
| Immigrants | Barbados | 0.0 /100 | #292 | Tragic 96.1% |
| Immigrants | West Indies | 0.0 /100 | #293 | Tragic 96.1% |
| British West Indians | 0.0 /100 | #294 | Tragic 96.0% |
| Immigrants | Grenada | 0.0 /100 | #295 | Tragic 95.9% |
| Immigrants | South Eastern Asia | 0.0 /100 | #296 | Tragic 95.9% |
| Haitians | 0.0 /100 | #297 | Tragic 95.8% |
| Sri Lankans | 0.0 /100 | #298 | Tragic 95.8% |
| Immigrants | Laos | 0.0 /100 | #299 | Tragic 95.7% |
| Immigrants | Dominica | 0.0 /100 | #300 | Tragic 95.7% |
| Immigrants | Immigrants | 0.0 /100 | #301 | Tragic 95.7% |
| Immigrants | Burma/Myanmar | 0.0 /100 | #302 | Tragic 95.7% |
| Bangladeshis | 0.0 /100 | #303 | Tragic 95.7% |
| Indonesians | 0.0 /100 | #304 | Tragic 95.6% |
Demographics Similar to Iranians by 6th Grade
In terms of 6th grade, the demographic groups most similar to Iranians are Cajun (97.6%, a difference of 0.010%), New Zealander (97.7%, a difference of 0.020%), Kiowa (97.7%, a difference of 0.020%), Immigrants from Austria (97.7%, a difference of 0.020%), and Chickasaw (97.6%, a difference of 0.020%).
| Demographics | Rating | Rank | 6th Grade |
| Immigrants | North America | 99.7 /100 | #62 | Exceptional 97.7% |
| Russians | 99.7 /100 | #63 | Exceptional 97.7% |
| Canadians | 99.7 /100 | #64 | Exceptional 97.7% |
| Immigrants | Northern Europe | 99.6 /100 | #65 | Exceptional 97.7% |
| New Zealanders | 99.6 /100 | #66 | Exceptional 97.7% |
| Kiowa | 99.6 /100 | #67 | Exceptional 97.7% |
| Immigrants | Austria | 99.6 /100 | #68 | Exceptional 97.7% |
| Iranians | 99.6 /100 | #69 | Exceptional 97.6% |
| Cajuns | 99.5 /100 | #70 | Exceptional 97.6% |
| Chickasaw | 99.5 /100 | #71 | Exceptional 97.6% |
| Macedonians | 99.4 /100 | #72 | Exceptional 97.6% |
| Cherokee | 99.4 /100 | #73 | Exceptional 97.6% |
| Immigrants | Netherlands | 99.4 /100 | #74 | Exceptional 97.6% |
| Ukrainians | 99.4 /100 | #75 | Exceptional 97.6% |
| Immigrants | England | 99.4 /100 | #76 | Exceptional 97.6% |