Immigrants from Switzerland vs Iranian 6th Grade
COMPARE
Immigrants from Switzerland
Iranian
6th Grade
6th Grade Comparison
Immigrants from Switzerland
Iranians
97.4%
6TH GRADE
95.7/ 100
METRIC RATING
115th/ 347
METRIC RANK
97.6%
6TH GRADE
99.6/ 100
METRIC RATING
69th/ 347
METRIC RANK
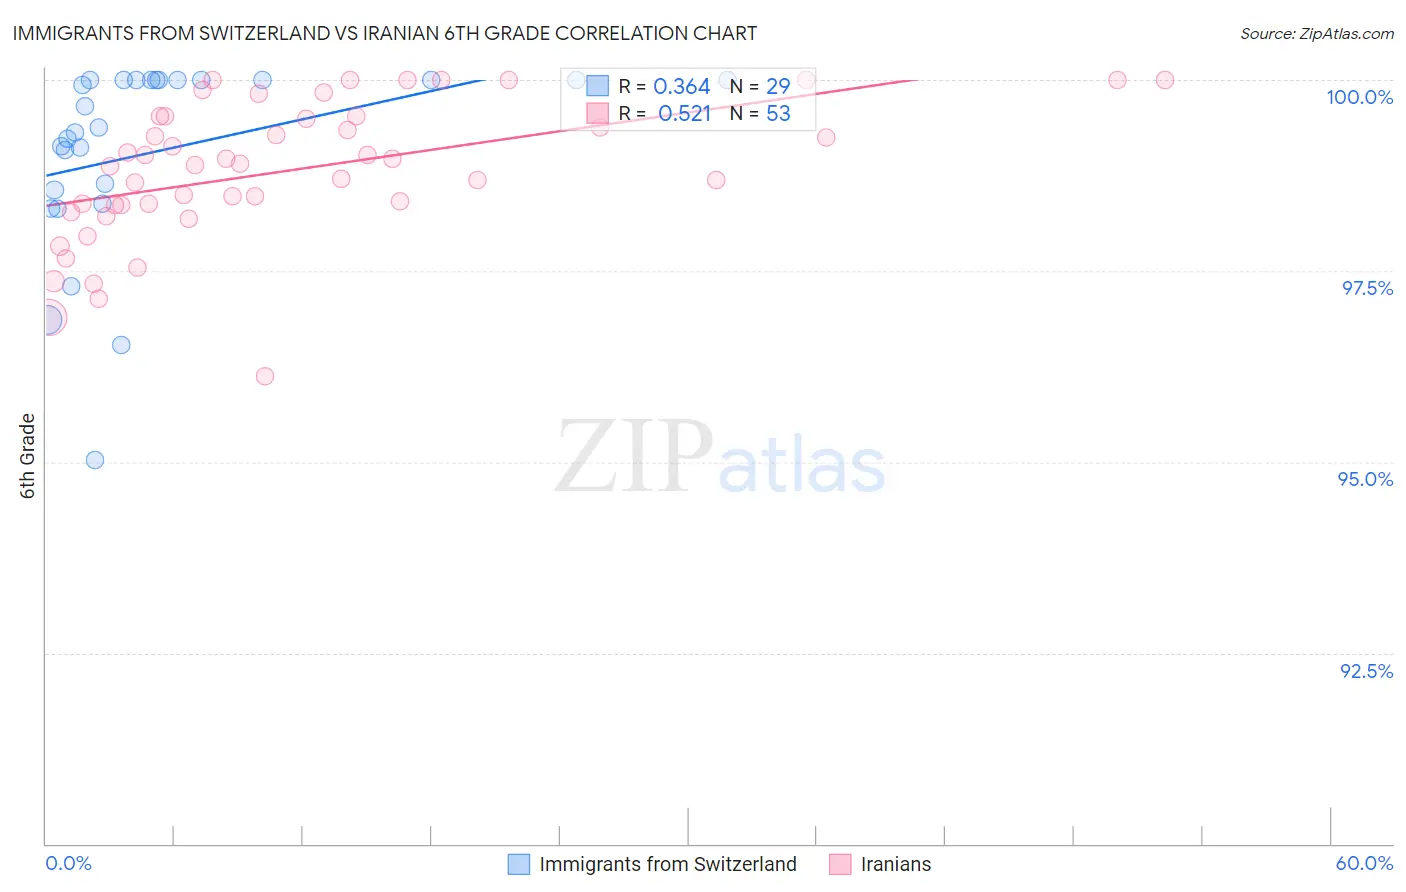
Immigrants from Switzerland vs Iranian 6th Grade Correlation Chart
The statistical analysis conducted on geographies consisting of 148,082,451 people shows a mild positive correlation between the proportion of Immigrants from Switzerland and percentage of population with at least 6th grade education in the United States with a correlation coefficient (R) of 0.364 and weighted average of 97.4%. Similarly, the statistical analysis conducted on geographies consisting of 310,636,461 people shows a substantial positive correlation between the proportion of Iranians and percentage of population with at least 6th grade education in the United States with a correlation coefficient (R) of 0.521 and weighted average of 97.6%, a difference of 0.26%.
6th Grade Correlation Summary
| Measurement | Immigrants from Switzerland | Iranian |
| Minimum | 95.0% | 96.1% |
| Maximum | 100.0% | 100.0% |
| Range | 5.0% | 3.9% |
| Mean | 99.1% | 98.8% |
| Median | 99.4% | 98.9% |
| Interquartile 25% (IQ1) | 98.5% | 98.4% |
| Interquartile 75% (IQ3) | 100.0% | 99.5% |
| Interquartile Range (IQR) | 1.5% | 1.2% |
| Standard Deviation (Sample) | 1.3% | 0.91% |
| Standard Deviation (Population) | 1.2% | 0.90% |
Similar Demographics by 6th Grade
Demographics Similar to Immigrants from Switzerland by 6th Grade
In terms of 6th grade, the demographic groups most similar to Immigrants from Switzerland are Lebanese (97.4%, a difference of 0.0%), Basque (97.4%, a difference of 0.010%), Immigrants from Japan (97.4%, a difference of 0.010%), Immigrants from Saudi Arabia (97.4%, a difference of 0.020%), and Colville (97.4%, a difference of 0.020%).
| Demographics | Rating | Rank | 6th Grade |
| Immigrants | Nonimmigrants | 97.3 /100 | #108 | Exceptional 97.4% |
| Immigrants | Czechoslovakia | 97.3 /100 | #109 | Exceptional 97.4% |
| Thais | 96.9 /100 | #110 | Exceptional 97.4% |
| Iroquois | 96.9 /100 | #111 | Exceptional 97.4% |
| Immigrants | Latvia | 96.7 /100 | #112 | Exceptional 97.4% |
| Immigrants | Saudi Arabia | 96.5 /100 | #113 | Exceptional 97.4% |
| Colville | 96.4 /100 | #114 | Exceptional 97.4% |
| Immigrants | Switzerland | 95.7 /100 | #115 | Exceptional 97.4% |
| Lebanese | 95.5 /100 | #116 | Exceptional 97.4% |
| Basques | 95.4 /100 | #117 | Exceptional 97.4% |
| Immigrants | Japan | 95.2 /100 | #118 | Exceptional 97.4% |
| Immigrants | Zimbabwe | 95.0 /100 | #119 | Exceptional 97.4% |
| Syrians | 94.8 /100 | #120 | Exceptional 97.4% |
| Immigrants | Norway | 94.7 /100 | #121 | Exceptional 97.4% |
| Immigrants | France | 94.5 /100 | #122 | Exceptional 97.4% |
Demographics Similar to Iranians by 6th Grade
In terms of 6th grade, the demographic groups most similar to Iranians are Cajun (97.6%, a difference of 0.010%), New Zealander (97.7%, a difference of 0.020%), Kiowa (97.7%, a difference of 0.020%), Immigrants from Austria (97.7%, a difference of 0.020%), and Chickasaw (97.6%, a difference of 0.020%).
| Demographics | Rating | Rank | 6th Grade |
| Immigrants | North America | 99.7 /100 | #62 | Exceptional 97.7% |
| Russians | 99.7 /100 | #63 | Exceptional 97.7% |
| Canadians | 99.7 /100 | #64 | Exceptional 97.7% |
| Immigrants | Northern Europe | 99.6 /100 | #65 | Exceptional 97.7% |
| New Zealanders | 99.6 /100 | #66 | Exceptional 97.7% |
| Kiowa | 99.6 /100 | #67 | Exceptional 97.7% |
| Immigrants | Austria | 99.6 /100 | #68 | Exceptional 97.7% |
| Iranians | 99.6 /100 | #69 | Exceptional 97.6% |
| Cajuns | 99.5 /100 | #70 | Exceptional 97.6% |
| Chickasaw | 99.5 /100 | #71 | Exceptional 97.6% |
| Macedonians | 99.4 /100 | #72 | Exceptional 97.6% |
| Cherokee | 99.4 /100 | #73 | Exceptional 97.6% |
| Immigrants | Netherlands | 99.4 /100 | #74 | Exceptional 97.6% |
| Ukrainians | 99.4 /100 | #75 | Exceptional 97.6% |
| Immigrants | England | 99.4 /100 | #76 | Exceptional 97.6% |