Haitian vs Immigrants from Liberia 6th Grade
COMPARE
Haitian
Immigrants from Liberia
6th Grade
6th Grade Comparison
Haitians
Immigrants from Liberia
95.8%
6TH GRADE
0.0/ 100
METRIC RATING
297th/ 347
METRIC RANK
96.6%
6TH GRADE
1.6/ 100
METRIC RATING
243rd/ 347
METRIC RANK
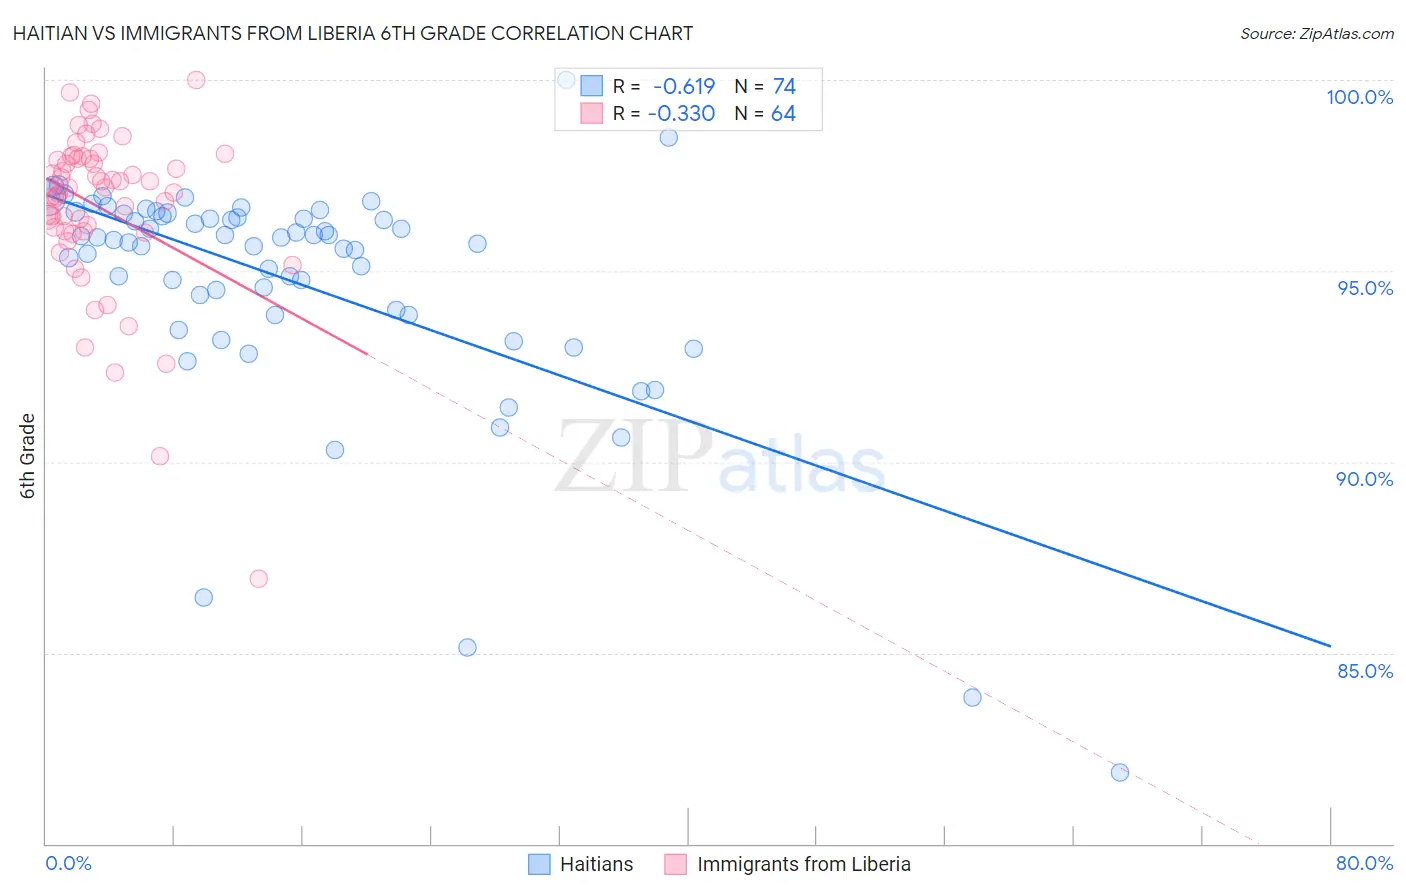
Haitian vs Immigrants from Liberia 6th Grade Correlation Chart
The statistical analysis conducted on geographies consisting of 288,018,742 people shows a significant negative correlation between the proportion of Haitians and percentage of population with at least 6th grade education in the United States with a correlation coefficient (R) of -0.619 and weighted average of 95.8%. Similarly, the statistical analysis conducted on geographies consisting of 135,294,272 people shows a mild negative correlation between the proportion of Immigrants from Liberia and percentage of population with at least 6th grade education in the United States with a correlation coefficient (R) of -0.330 and weighted average of 96.6%, a difference of 0.80%.
6th Grade Correlation Summary
| Measurement | Haitian | Immigrants from Liberia |
| Minimum | 81.9% | 86.9% |
| Maximum | 100.0% | 100.0% |
| Range | 18.1% | 13.1% |
| Mean | 94.7% | 96.7% |
| Median | 95.8% | 97.2% |
| Interquartile 25% (IQ1) | 93.8% | 96.0% |
| Interquartile 75% (IQ3) | 96.4% | 97.9% |
| Interquartile Range (IQR) | 2.6% | 1.9% |
| Standard Deviation (Sample) | 3.1% | 2.2% |
| Standard Deviation (Population) | 3.1% | 2.2% |
Similar Demographics by 6th Grade
Demographics Similar to Haitians by 6th Grade
In terms of 6th grade, the demographic groups most similar to Haitians are Sri Lankan (95.8%, a difference of 0.070%), Immigrants from Laos (95.7%, a difference of 0.080%), Immigrants from Dominica (95.7%, a difference of 0.090%), Immigrants (95.7%, a difference of 0.10%), and Immigrants from South Eastern Asia (95.9%, a difference of 0.11%).
| Demographics | Rating | Rank | 6th Grade |
| Immigrants | Somalia | 0.0 /100 | #290 | Tragic 96.1% |
| Immigrants | St. Vincent and the Grenadines | 0.0 /100 | #291 | Tragic 96.1% |
| Immigrants | Barbados | 0.0 /100 | #292 | Tragic 96.1% |
| Immigrants | West Indies | 0.0 /100 | #293 | Tragic 96.1% |
| British West Indians | 0.0 /100 | #294 | Tragic 96.0% |
| Immigrants | Grenada | 0.0 /100 | #295 | Tragic 95.9% |
| Immigrants | South Eastern Asia | 0.0 /100 | #296 | Tragic 95.9% |
| Haitians | 0.0 /100 | #297 | Tragic 95.8% |
| Sri Lankans | 0.0 /100 | #298 | Tragic 95.8% |
| Immigrants | Laos | 0.0 /100 | #299 | Tragic 95.7% |
| Immigrants | Dominica | 0.0 /100 | #300 | Tragic 95.7% |
| Immigrants | Immigrants | 0.0 /100 | #301 | Tragic 95.7% |
| Immigrants | Burma/Myanmar | 0.0 /100 | #302 | Tragic 95.7% |
| Bangladeshis | 0.0 /100 | #303 | Tragic 95.7% |
| Indonesians | 0.0 /100 | #304 | Tragic 95.6% |
Demographics Similar to Immigrants from Liberia by 6th Grade
In terms of 6th grade, the demographic groups most similar to Immigrants from Liberia are Senegalese (96.6%, a difference of 0.010%), Immigrants from Asia (96.6%, a difference of 0.010%), Ethiopian (96.6%, a difference of 0.010%), Nigerian (96.6%, a difference of 0.020%), and Indian (Asian) (96.6%, a difference of 0.020%).
| Demographics | Rating | Rank | 6th Grade |
| Immigrants | Indonesia | 2.3 /100 | #236 | Tragic 96.6% |
| Immigrants | Eastern Africa | 2.0 /100 | #237 | Tragic 96.6% |
| Nigerians | 1.9 /100 | #238 | Tragic 96.6% |
| Indians (Asian) | 1.9 /100 | #239 | Tragic 96.6% |
| Koreans | 1.9 /100 | #240 | Tragic 96.6% |
| Senegalese | 1.8 /100 | #241 | Tragic 96.6% |
| Immigrants | Asia | 1.8 /100 | #242 | Tragic 96.6% |
| Immigrants | Liberia | 1.6 /100 | #243 | Tragic 96.6% |
| Ethiopians | 1.5 /100 | #244 | Tragic 96.6% |
| Immigrants | Costa Rica | 1.3 /100 | #245 | Tragic 96.6% |
| Immigrants | Africa | 1.3 /100 | #246 | Tragic 96.6% |
| Bolivians | 1.0 /100 | #247 | Tragic 96.5% |
| Tohono O'odham | 1.0 /100 | #248 | Tragic 96.5% |
| Colombians | 0.9 /100 | #249 | Tragic 96.5% |
| Immigrants | Middle Africa | 0.8 /100 | #250 | Tragic 96.5% |