Haitian vs Immigrants from Syria GED/Equivalency
COMPARE
Haitian
Immigrants from Syria
GED/Equivalency
GED/Equivalency Comparison
Haitians
Immigrants from Syria
82.1%
GED/EQUIVALENCY
0.0/ 100
METRIC RATING
290th/ 347
METRIC RANK
86.1%
GED/EQUIVALENCY
69.3/ 100
METRIC RATING
161st/ 347
METRIC RANK
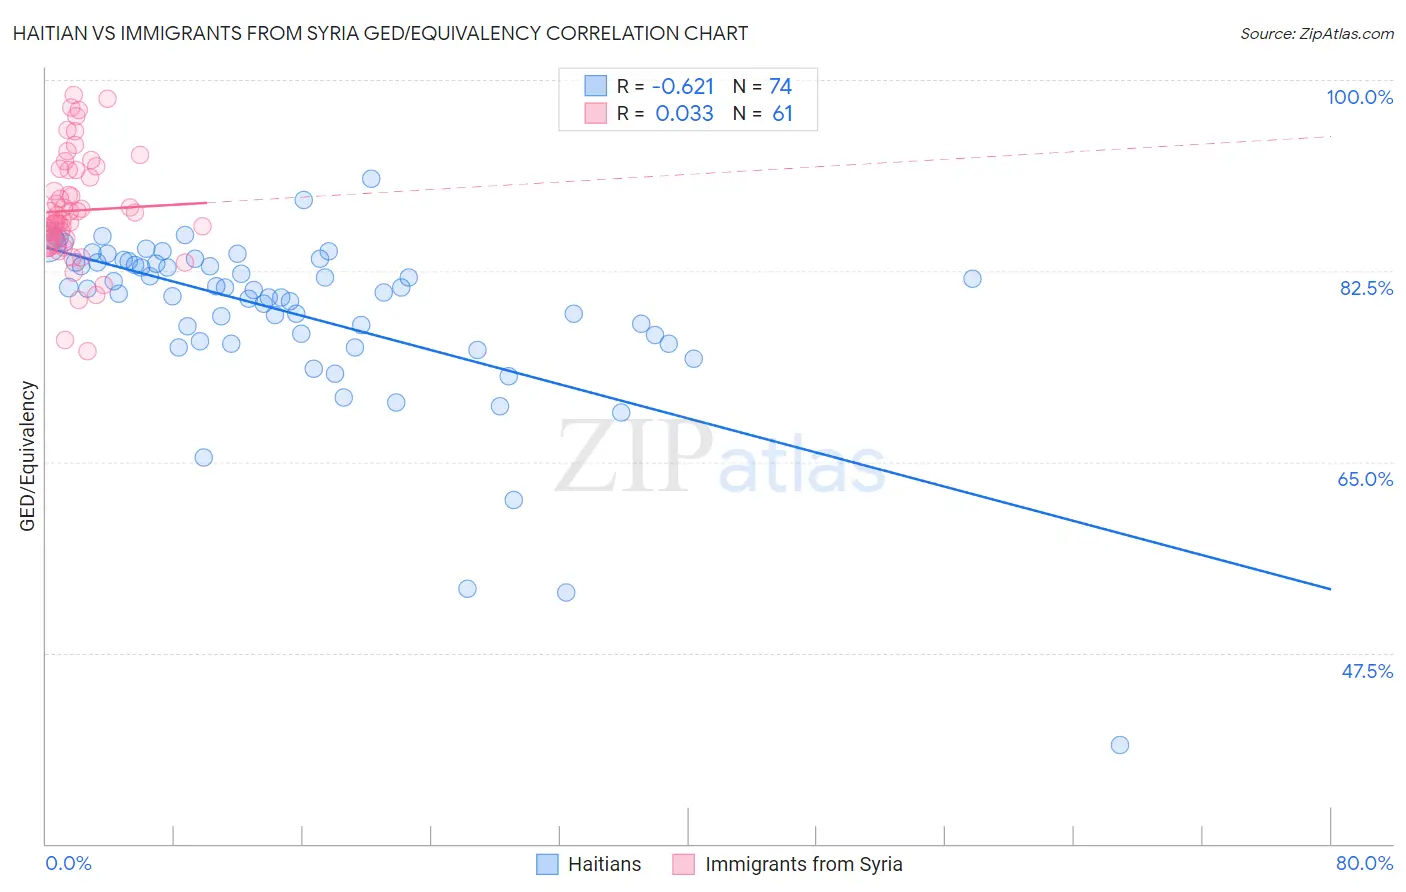
Haitian vs Immigrants from Syria GED/Equivalency Correlation Chart
The statistical analysis conducted on geographies consisting of 288,018,742 people shows a significant negative correlation between the proportion of Haitians and percentage of population with at least ged/equivalency education in the United States with a correlation coefficient (R) of -0.621 and weighted average of 82.1%. Similarly, the statistical analysis conducted on geographies consisting of 174,108,882 people shows no correlation between the proportion of Immigrants from Syria and percentage of population with at least ged/equivalency education in the United States with a correlation coefficient (R) of 0.033 and weighted average of 86.1%, a difference of 4.9%.
GED/Equivalency Correlation Summary
| Measurement | Haitian | Immigrants from Syria |
| Minimum | 39.0% | 75.1% |
| Maximum | 90.9% | 98.7% |
| Range | 51.9% | 23.5% |
| Mean | 78.6% | 88.0% |
| Median | 80.8% | 87.1% |
| Interquartile 25% (IQ1) | 76.1% | 85.0% |
| Interquartile 75% (IQ3) | 83.3% | 91.8% |
| Interquartile Range (IQR) | 7.2% | 6.7% |
| Standard Deviation (Sample) | 8.2% | 5.0% |
| Standard Deviation (Population) | 8.1% | 4.9% |
Similar Demographics by GED/Equivalency
Demographics Similar to Haitians by GED/Equivalency
In terms of ged/equivalency, the demographic groups most similar to Haitians are Cuban (82.0%, a difference of 0.020%), Paiute (82.0%, a difference of 0.060%), British West Indian (82.0%, a difference of 0.070%), Immigrants from St. Vincent and the Grenadines (82.0%, a difference of 0.090%), and Nepalese (81.9%, a difference of 0.15%).
| Demographics | Rating | Rank | GED/Equivalency |
| Indonesians | 0.1 /100 | #283 | Tragic 82.5% |
| Immigrants | Barbados | 0.1 /100 | #284 | Tragic 82.4% |
| Cajuns | 0.0 /100 | #285 | Tragic 82.4% |
| Immigrants | West Indies | 0.0 /100 | #286 | Tragic 82.4% |
| Japanese | 0.0 /100 | #287 | Tragic 82.4% |
| Pueblo | 0.0 /100 | #288 | Tragic 82.3% |
| Immigrants | Cambodia | 0.0 /100 | #289 | Tragic 82.2% |
| Haitians | 0.0 /100 | #290 | Tragic 82.1% |
| Cubans | 0.0 /100 | #291 | Tragic 82.0% |
| Paiute | 0.0 /100 | #292 | Tragic 82.0% |
| British West Indians | 0.0 /100 | #293 | Tragic 82.0% |
| Immigrants | St. Vincent and the Grenadines | 0.0 /100 | #294 | Tragic 82.0% |
| Nepalese | 0.0 /100 | #295 | Tragic 81.9% |
| Vietnamese | 0.0 /100 | #296 | Tragic 81.9% |
| Immigrants | Bangladesh | 0.0 /100 | #297 | Tragic 81.9% |
Demographics Similar to Immigrants from Syria by GED/Equivalency
In terms of ged/equivalency, the demographic groups most similar to Immigrants from Syria are Immigrants from Morocco (86.1%, a difference of 0.010%), Immigrants from Iraq (86.1%, a difference of 0.030%), Immigrants from Kenya (86.2%, a difference of 0.060%), White/Caucasian (86.2%, a difference of 0.070%), and German Russian (86.2%, a difference of 0.070%).
| Demographics | Rating | Rank | GED/Equivalency |
| Armenians | 76.4 /100 | #154 | Good 86.3% |
| Iraqis | 75.2 /100 | #155 | Good 86.2% |
| Immigrants | Nepal | 73.3 /100 | #156 | Good 86.2% |
| Whites/Caucasians | 72.2 /100 | #157 | Good 86.2% |
| German Russians | 72.1 /100 | #158 | Good 86.2% |
| Immigrants | Kenya | 71.8 /100 | #159 | Good 86.2% |
| Immigrants | Morocco | 69.5 /100 | #160 | Good 86.1% |
| Immigrants | Syria | 69.3 /100 | #161 | Good 86.1% |
| Immigrants | Iraq | 68.1 /100 | #162 | Good 86.1% |
| Ugandans | 66.3 /100 | #163 | Good 86.1% |
| Venezuelans | 65.5 /100 | #164 | Good 86.0% |
| Alsatians | 64.3 /100 | #165 | Good 86.0% |
| Immigrants | Albania | 64.2 /100 | #166 | Good 86.0% |
| Ethiopians | 63.7 /100 | #167 | Good 86.0% |
| Sierra Leoneans | 61.8 /100 | #168 | Good 86.0% |