Haitian vs Immigrants from Sierra Leone GED/Equivalency
COMPARE
Haitian
Immigrants from Sierra Leone
GED/Equivalency
GED/Equivalency Comparison
Haitians
Immigrants from Sierra Leone
82.1%
GED/EQUIVALENCY
0.0/ 100
METRIC RATING
290th/ 347
METRIC RANK
85.4%
GED/EQUIVALENCY
29.0/ 100
METRIC RATING
188th/ 347
METRIC RANK
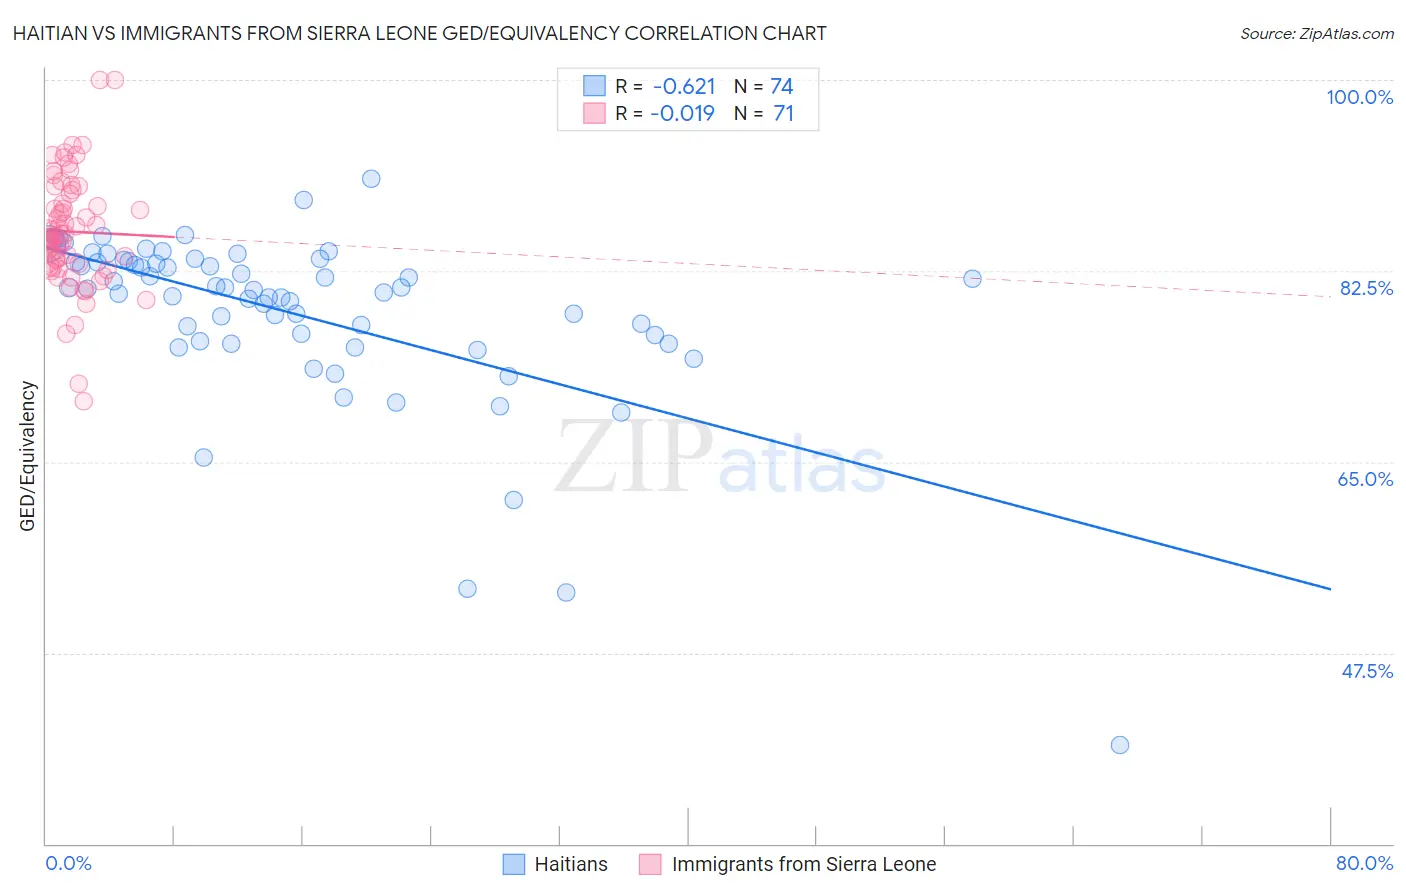
Haitian vs Immigrants from Sierra Leone GED/Equivalency Correlation Chart
The statistical analysis conducted on geographies consisting of 288,018,742 people shows a significant negative correlation between the proportion of Haitians and percentage of population with at least ged/equivalency education in the United States with a correlation coefficient (R) of -0.621 and weighted average of 82.1%. Similarly, the statistical analysis conducted on geographies consisting of 101,654,421 people shows no correlation between the proportion of Immigrants from Sierra Leone and percentage of population with at least ged/equivalency education in the United States with a correlation coefficient (R) of -0.019 and weighted average of 85.4%, a difference of 4.0%.
GED/Equivalency Correlation Summary
| Measurement | Haitian | Immigrants from Sierra Leone |
| Minimum | 39.0% | 70.6% |
| Maximum | 90.9% | 100.0% |
| Range | 51.9% | 29.4% |
| Mean | 78.6% | 86.1% |
| Median | 80.8% | 85.7% |
| Interquartile 25% (IQ1) | 76.1% | 82.9% |
| Interquartile 75% (IQ3) | 83.3% | 89.6% |
| Interquartile Range (IQR) | 7.2% | 6.7% |
| Standard Deviation (Sample) | 8.2% | 5.2% |
| Standard Deviation (Population) | 8.1% | 5.2% |
Similar Demographics by GED/Equivalency
Demographics Similar to Haitians by GED/Equivalency
In terms of ged/equivalency, the demographic groups most similar to Haitians are Cuban (82.0%, a difference of 0.020%), Paiute (82.0%, a difference of 0.060%), British West Indian (82.0%, a difference of 0.070%), Immigrants from St. Vincent and the Grenadines (82.0%, a difference of 0.090%), and Nepalese (81.9%, a difference of 0.15%).
| Demographics | Rating | Rank | GED/Equivalency |
| Indonesians | 0.1 /100 | #283 | Tragic 82.5% |
| Immigrants | Barbados | 0.1 /100 | #284 | Tragic 82.4% |
| Cajuns | 0.0 /100 | #285 | Tragic 82.4% |
| Immigrants | West Indies | 0.0 /100 | #286 | Tragic 82.4% |
| Japanese | 0.0 /100 | #287 | Tragic 82.4% |
| Pueblo | 0.0 /100 | #288 | Tragic 82.3% |
| Immigrants | Cambodia | 0.0 /100 | #289 | Tragic 82.2% |
| Haitians | 0.0 /100 | #290 | Tragic 82.1% |
| Cubans | 0.0 /100 | #291 | Tragic 82.0% |
| Paiute | 0.0 /100 | #292 | Tragic 82.0% |
| British West Indians | 0.0 /100 | #293 | Tragic 82.0% |
| Immigrants | St. Vincent and the Grenadines | 0.0 /100 | #294 | Tragic 82.0% |
| Nepalese | 0.0 /100 | #295 | Tragic 81.9% |
| Vietnamese | 0.0 /100 | #296 | Tragic 81.9% |
| Immigrants | Bangladesh | 0.0 /100 | #297 | Tragic 81.9% |
Demographics Similar to Immigrants from Sierra Leone by GED/Equivalency
In terms of ged/equivalency, the demographic groups most similar to Immigrants from Sierra Leone are Guamanian/Chamorro (85.3%, a difference of 0.010%), Immigrants from Afghanistan (85.4%, a difference of 0.020%), Alaskan Athabascan (85.3%, a difference of 0.040%), Spaniard (85.4%, a difference of 0.070%), and Spanish (85.4%, a difference of 0.090%).
| Demographics | Rating | Rank | GED/Equivalency |
| Moroccans | 37.7 /100 | #181 | Fair 85.5% |
| Sudanese | 35.2 /100 | #182 | Fair 85.5% |
| Immigrants | Sudan | 34.2 /100 | #183 | Fair 85.5% |
| Immigrants | Oceania | 33.6 /100 | #184 | Fair 85.5% |
| Spanish | 32.8 /100 | #185 | Fair 85.4% |
| Spaniards | 31.9 /100 | #186 | Fair 85.4% |
| Immigrants | Afghanistan | 29.8 /100 | #187 | Fair 85.4% |
| Immigrants | Sierra Leone | 29.0 /100 | #188 | Fair 85.4% |
| Guamanians/Chamorros | 28.4 /100 | #189 | Fair 85.3% |
| Alaskan Athabascans | 27.5 /100 | #190 | Fair 85.3% |
| South American Indians | 22.8 /100 | #191 | Fair 85.2% |
| Immigrants | Nonimmigrants | 22.7 /100 | #192 | Fair 85.2% |
| Delaware | 22.2 /100 | #193 | Fair 85.2% |
| Puget Sound Salish | 20.8 /100 | #194 | Fair 85.2% |
| Chippewa | 20.8 /100 | #195 | Fair 85.2% |