Yugoslavian vs Immigrants from Liberia 6th Grade
COMPARE
Yugoslavian
Immigrants from Liberia
6th Grade
6th Grade Comparison
Yugoslavians
Immigrants from Liberia
97.5%
6TH GRADE
98.5/ 100
METRIC RATING
99th/ 347
METRIC RANK
96.6%
6TH GRADE
1.6/ 100
METRIC RATING
243rd/ 347
METRIC RANK
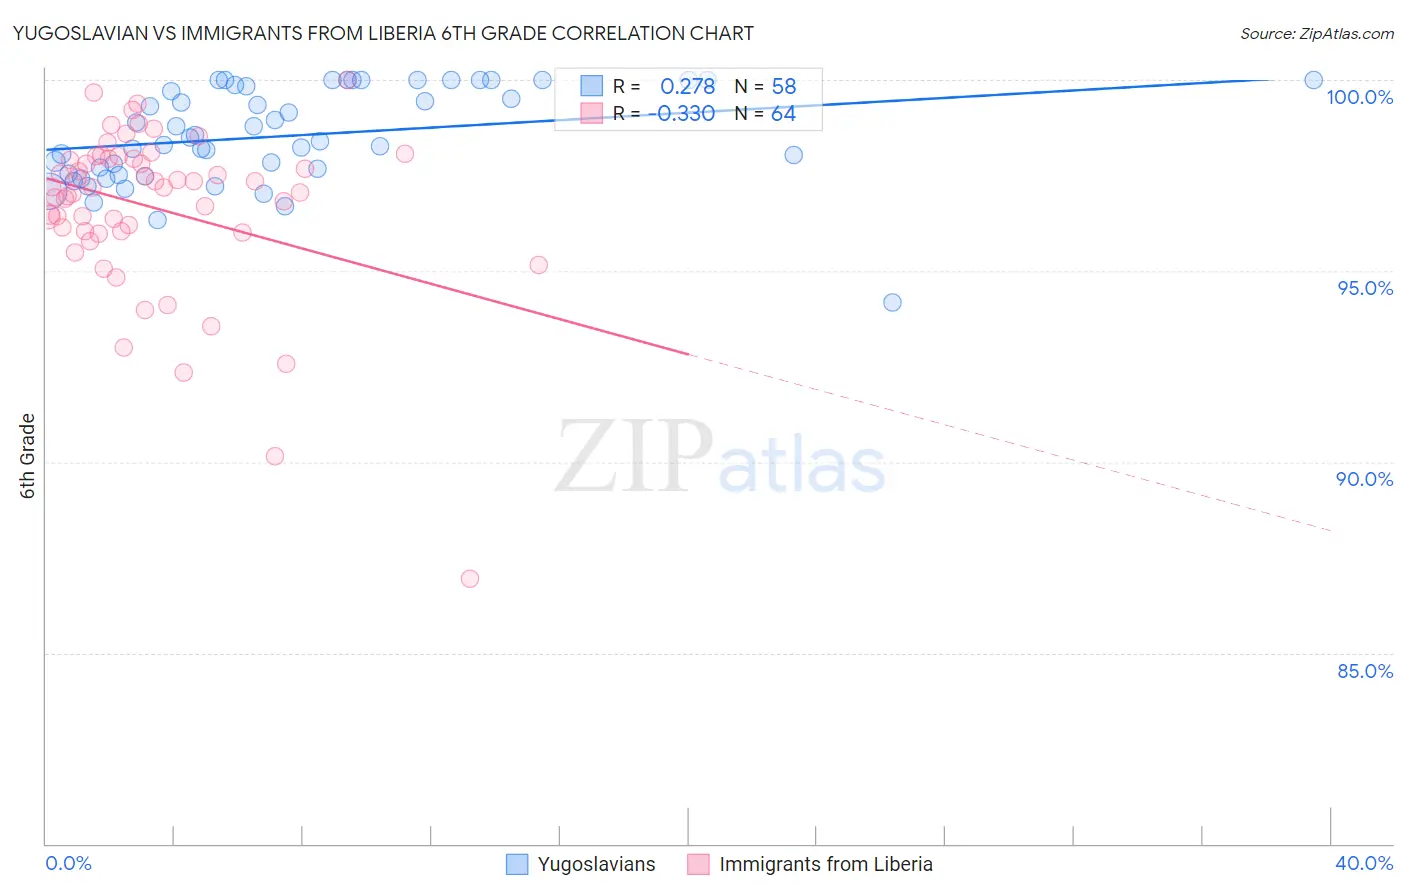
Yugoslavian vs Immigrants from Liberia 6th Grade Correlation Chart
The statistical analysis conducted on geographies consisting of 285,618,157 people shows a weak positive correlation between the proportion of Yugoslavians and percentage of population with at least 6th grade education in the United States with a correlation coefficient (R) of 0.278 and weighted average of 97.5%. Similarly, the statistical analysis conducted on geographies consisting of 135,294,272 people shows a mild negative correlation between the proportion of Immigrants from Liberia and percentage of population with at least 6th grade education in the United States with a correlation coefficient (R) of -0.330 and weighted average of 96.6%, a difference of 0.95%.
6th Grade Correlation Summary
| Measurement | Yugoslavian | Immigrants from Liberia |
| Minimum | 94.2% | 86.9% |
| Maximum | 100.0% | 100.0% |
| Range | 5.8% | 13.1% |
| Mean | 98.5% | 96.7% |
| Median | 98.4% | 97.2% |
| Interquartile 25% (IQ1) | 97.6% | 96.0% |
| Interquartile 75% (IQ3) | 99.9% | 97.9% |
| Interquartile Range (IQR) | 2.3% | 1.9% |
| Standard Deviation (Sample) | 1.3% | 2.2% |
| Standard Deviation (Population) | 1.2% | 2.2% |
Similar Demographics by 6th Grade
Demographics Similar to Yugoslavians by 6th Grade
In terms of 6th grade, the demographic groups most similar to Yugoslavians are Immigrants from Denmark (97.5%, a difference of 0.0%), Cree (97.5%, a difference of 0.010%), Cypriot (97.5%, a difference of 0.010%), Immigrants from Ireland (97.5%, a difference of 0.010%), and Immigrants from Germany (97.5%, a difference of 0.010%).
| Demographics | Rating | Rank | 6th Grade |
| Romanians | 98.7 /100 | #92 | Exceptional 97.5% |
| Cree | 98.7 /100 | #93 | Exceptional 97.5% |
| Cypriots | 98.7 /100 | #94 | Exceptional 97.5% |
| Immigrants | Ireland | 98.7 /100 | #95 | Exceptional 97.5% |
| Immigrants | Germany | 98.6 /100 | #96 | Exceptional 97.5% |
| Immigrants | Sweden | 98.6 /100 | #97 | Exceptional 97.5% |
| Immigrants | Denmark | 98.5 /100 | #98 | Exceptional 97.5% |
| Yugoslavians | 98.5 /100 | #99 | Exceptional 97.5% |
| Turks | 98.3 /100 | #100 | Exceptional 97.5% |
| South Africans | 98.2 /100 | #101 | Exceptional 97.5% |
| Choctaw | 98.0 /100 | #102 | Exceptional 97.5% |
| Bhutanese | 98.0 /100 | #103 | Exceptional 97.5% |
| German Russians | 97.9 /100 | #104 | Exceptional 97.5% |
| Cheyenne | 97.9 /100 | #105 | Exceptional 97.5% |
| Menominee | 97.7 /100 | #106 | Exceptional 97.5% |
Demographics Similar to Immigrants from Liberia by 6th Grade
In terms of 6th grade, the demographic groups most similar to Immigrants from Liberia are Senegalese (96.6%, a difference of 0.010%), Immigrants from Asia (96.6%, a difference of 0.010%), Ethiopian (96.6%, a difference of 0.010%), Nigerian (96.6%, a difference of 0.020%), and Indian (Asian) (96.6%, a difference of 0.020%).
| Demographics | Rating | Rank | 6th Grade |
| Immigrants | Indonesia | 2.3 /100 | #236 | Tragic 96.6% |
| Immigrants | Eastern Africa | 2.0 /100 | #237 | Tragic 96.6% |
| Nigerians | 1.9 /100 | #238 | Tragic 96.6% |
| Indians (Asian) | 1.9 /100 | #239 | Tragic 96.6% |
| Koreans | 1.9 /100 | #240 | Tragic 96.6% |
| Senegalese | 1.8 /100 | #241 | Tragic 96.6% |
| Immigrants | Asia | 1.8 /100 | #242 | Tragic 96.6% |
| Immigrants | Liberia | 1.6 /100 | #243 | Tragic 96.6% |
| Ethiopians | 1.5 /100 | #244 | Tragic 96.6% |
| Immigrants | Costa Rica | 1.3 /100 | #245 | Tragic 96.6% |
| Immigrants | Africa | 1.3 /100 | #246 | Tragic 96.6% |
| Bolivians | 1.0 /100 | #247 | Tragic 96.5% |
| Tohono O'odham | 1.0 /100 | #248 | Tragic 96.5% |
| Colombians | 0.9 /100 | #249 | Tragic 96.5% |
| Immigrants | Middle Africa | 0.8 /100 | #250 | Tragic 96.5% |