Guamanian/Chamorro vs Moroccan Master's Degree
COMPARE
Guamanian/Chamorro
Moroccan
Master's Degree
Master's Degree Comparison
Guamanians/Chamorros
Moroccans
13.1%
MASTER'S DEGREE
2.2/ 100
METRIC RATING
240th/ 347
METRIC RANK
16.8%
MASTER'S DEGREE
98.0/ 100
METRIC RATING
109th/ 347
METRIC RANK
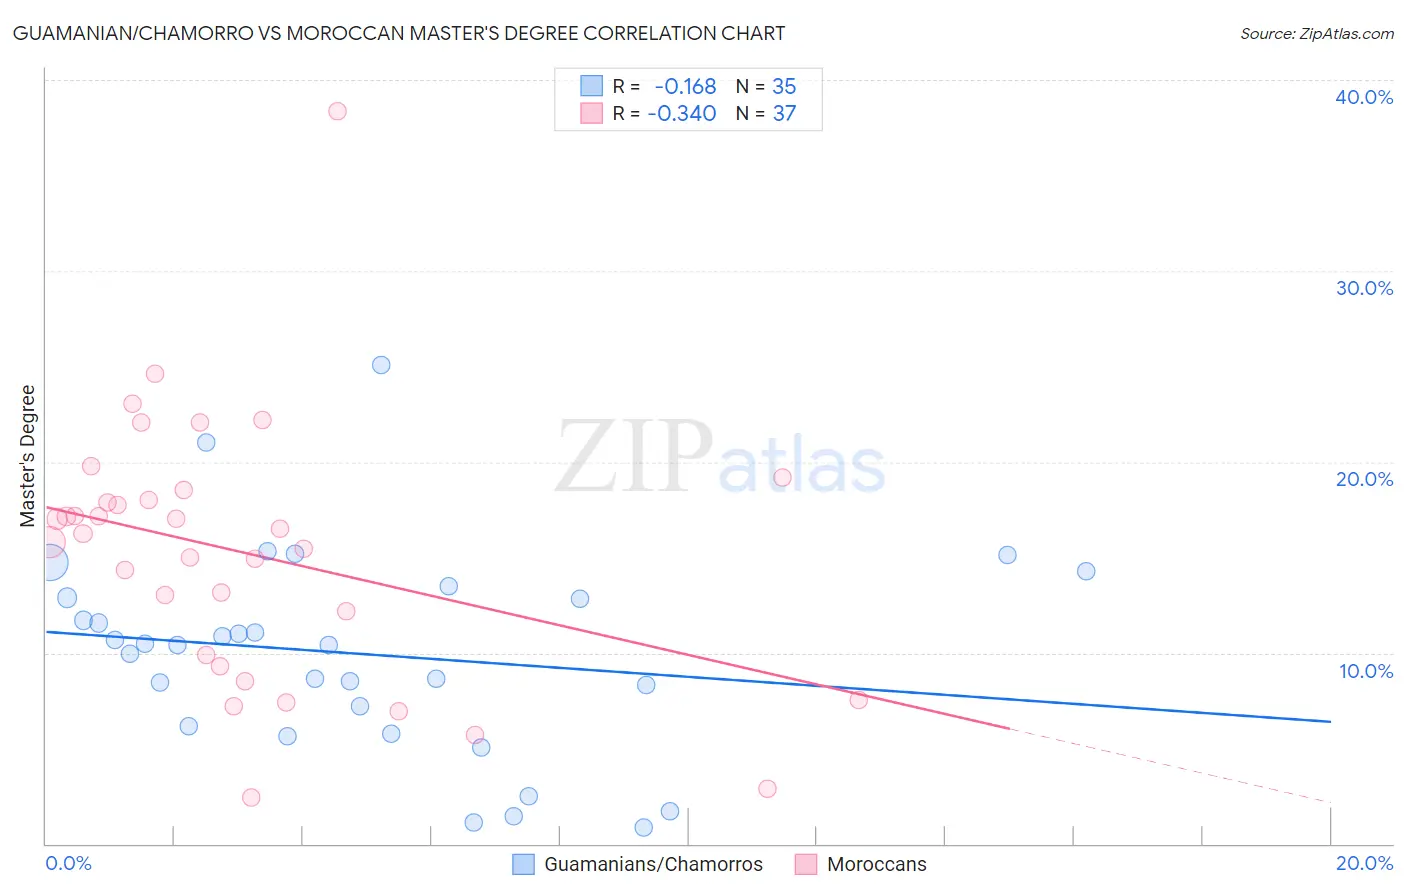
Guamanian/Chamorro vs Moroccan Master's Degree Correlation Chart
The statistical analysis conducted on geographies consisting of 221,931,951 people shows a poor negative correlation between the proportion of Guamanians/Chamorros and percentage of population with at least master's degree education in the United States with a correlation coefficient (R) of -0.168 and weighted average of 13.1%. Similarly, the statistical analysis conducted on geographies consisting of 201,797,858 people shows a mild negative correlation between the proportion of Moroccans and percentage of population with at least master's degree education in the United States with a correlation coefficient (R) of -0.340 and weighted average of 16.8%, a difference of 28.1%.
Master's Degree Correlation Summary
| Measurement | Guamanian/Chamorro | Moroccan |
| Minimum | 0.85% | 2.4% |
| Maximum | 25.0% | 38.4% |
| Range | 24.2% | 36.0% |
| Mean | 9.9% | 15.2% |
| Median | 10.4% | 16.2% |
| Interquartile 25% (IQ1) | 6.1% | 9.6% |
| Interquartile 75% (IQ3) | 12.9% | 18.2% |
| Interquartile Range (IQR) | 6.7% | 8.7% |
| Standard Deviation (Sample) | 5.3% | 6.9% |
| Standard Deviation (Population) | 5.2% | 6.8% |
Similar Demographics by Master's Degree
Demographics Similar to Guamanians/Chamorros by Master's Degree
In terms of master's degree, the demographic groups most similar to Guamanians/Chamorros are U.S. Virgin Islander (13.1%, a difference of 0.14%), Spanish American (13.0%, a difference of 0.43%), Immigrants from Jamaica (13.0%, a difference of 0.47%), Delaware (13.0%, a difference of 0.85%), and Immigrants from Bahamas (12.9%, a difference of 1.5%).
| Demographics | Rating | Rank | Master's Degree |
| Immigrants | Ecuador | 5.7 /100 | #233 | Tragic 13.6% |
| Immigrants | Burma/Myanmar | 5.0 /100 | #234 | Tragic 13.5% |
| German Russians | 4.5 /100 | #235 | Tragic 13.5% |
| Immigrants | Guyana | 4.4 /100 | #236 | Tragic 13.4% |
| Jamaicans | 4.1 /100 | #237 | Tragic 13.4% |
| Hmong | 4.0 /100 | #238 | Tragic 13.4% |
| Immigrants | Nonimmigrants | 3.4 /100 | #239 | Tragic 13.3% |
| Guamanians/Chamorros | 2.2 /100 | #240 | Tragic 13.1% |
| U.S. Virgin Islanders | 2.1 /100 | #241 | Tragic 13.1% |
| Spanish Americans | 1.9 /100 | #242 | Tragic 13.0% |
| Immigrants | Jamaica | 1.9 /100 | #243 | Tragic 13.0% |
| Delaware | 1.7 /100 | #244 | Tragic 13.0% |
| Immigrants | Bahamas | 1.4 /100 | #245 | Tragic 12.9% |
| Immigrants | Cambodia | 1.4 /100 | #246 | Tragic 12.9% |
| Iroquois | 1.4 /100 | #247 | Tragic 12.9% |
Demographics Similar to Moroccans by Master's Degree
In terms of master's degree, the demographic groups most similar to Moroccans are Sierra Leonean (16.8%, a difference of 0.020%), Immigrants from Chile (16.8%, a difference of 0.030%), Armenian (16.8%, a difference of 0.050%), Immigrants from Albania (16.8%, a difference of 0.14%), and Austrian (16.7%, a difference of 0.30%).
| Demographics | Rating | Rank | Master's Degree |
| Chileans | 98.6 /100 | #102 | Exceptional 16.9% |
| Alsatians | 98.4 /100 | #103 | Exceptional 16.9% |
| Ukrainians | 98.3 /100 | #104 | Exceptional 16.9% |
| Syrians | 98.3 /100 | #105 | Exceptional 16.8% |
| Immigrants | Albania | 98.1 /100 | #106 | Exceptional 16.8% |
| Armenians | 98.0 /100 | #107 | Exceptional 16.8% |
| Sierra Leoneans | 98.0 /100 | #108 | Exceptional 16.8% |
| Moroccans | 98.0 /100 | #109 | Exceptional 16.8% |
| Immigrants | Chile | 98.0 /100 | #110 | Exceptional 16.8% |
| Austrians | 97.8 /100 | #111 | Exceptional 16.7% |
| Macedonians | 97.7 /100 | #112 | Exceptional 16.7% |
| Arabs | 97.7 /100 | #113 | Exceptional 16.7% |
| Northern Europeans | 97.6 /100 | #114 | Exceptional 16.7% |
| Immigrants | Uganda | 97.3 /100 | #115 | Exceptional 16.6% |
| Immigrants | Southern Europe | 97.2 /100 | #116 | Exceptional 16.6% |