Dutch vs Laotian Doctorate Degree
COMPARE
Dutch
Laotian
Doctorate Degree
Doctorate Degree Comparison
Dutch
Laotians
1.8%
DOCTORATE DEGREE
27.4/ 100
METRIC RATING
192nd/ 347
METRIC RANK
2.3%
DOCTORATE DEGREE
99.9/ 100
METRIC RATING
63rd/ 347
METRIC RANK
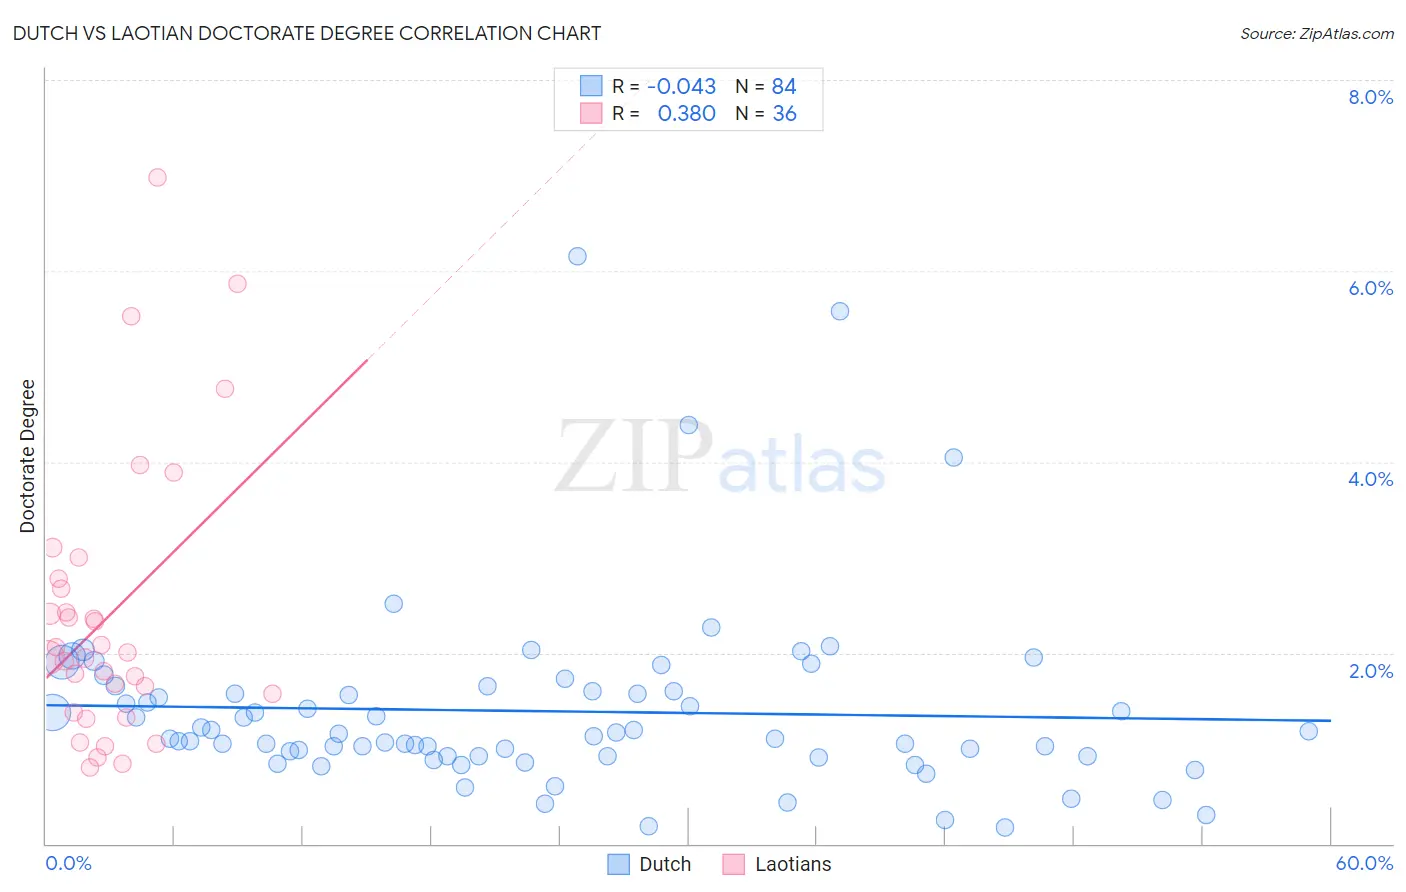
Dutch vs Laotian Doctorate Degree Correlation Chart
The statistical analysis conducted on geographies consisting of 532,685,178 people shows no correlation between the proportion of Dutch and percentage of population with at least doctorate degree education in the United States with a correlation coefficient (R) of -0.043 and weighted average of 1.8%. Similarly, the statistical analysis conducted on geographies consisting of 224,228,494 people shows a mild positive correlation between the proportion of Laotians and percentage of population with at least doctorate degree education in the United States with a correlation coefficient (R) of 0.380 and weighted average of 2.3%, a difference of 30.1%.
Doctorate Degree Correlation Summary
| Measurement | Dutch | Laotian |
| Minimum | 0.18% | 0.80% |
| Maximum | 6.2% | 7.0% |
| Range | 6.0% | 6.2% |
| Mean | 1.4% | 2.4% |
| Median | 1.1% | 2.0% |
| Interquartile 25% (IQ1) | 0.91% | 1.5% |
| Interquartile 75% (IQ3) | 1.6% | 2.7% |
| Interquartile Range (IQR) | 0.68% | 1.3% |
| Standard Deviation (Sample) | 0.98% | 1.5% |
| Standard Deviation (Population) | 0.97% | 1.4% |
Similar Demographics by Doctorate Degree
Demographics Similar to Dutch by Doctorate Degree
In terms of doctorate degree, the demographic groups most similar to Dutch are German Russian (1.8%, a difference of 0.070%), Uruguayan (1.8%, a difference of 0.24%), South American (1.8%, a difference of 0.39%), Immigrants from Somalia (1.8%, a difference of 0.39%), and Subsaharan African (1.8%, a difference of 0.46%).
| Demographics | Rating | Rank | Doctorate Degree |
| Slovaks | 36.4 /100 | #185 | Fair 1.8% |
| Peruvians | 34.4 /100 | #186 | Fair 1.8% |
| Czechoslovakians | 33.0 /100 | #187 | Fair 1.8% |
| Germans | 30.5 /100 | #188 | Fair 1.8% |
| French Canadians | 30.2 /100 | #189 | Fair 1.8% |
| Immigrants | Costa Rica | 30.2 /100 | #190 | Fair 1.8% |
| South Americans | 29.5 /100 | #191 | Fair 1.8% |
| Dutch | 27.4 /100 | #192 | Fair 1.8% |
| German Russians | 27.1 /100 | #193 | Fair 1.8% |
| Uruguayans | 26.2 /100 | #194 | Fair 1.8% |
| Immigrants | Somalia | 25.4 /100 | #195 | Fair 1.8% |
| Sub-Saharan Africans | 25.1 /100 | #196 | Fair 1.8% |
| Chinese | 25.1 /100 | #197 | Fair 1.8% |
| Immigrants | Ghana | 24.6 /100 | #198 | Fair 1.8% |
| Immigrants | South America | 23.3 /100 | #199 | Fair 1.8% |
Demographics Similar to Laotians by Doctorate Degree
In terms of doctorate degree, the demographic groups most similar to Laotians are Immigrants from Europe (2.3%, a difference of 0.090%), Immigrants from Greece (2.3%, a difference of 0.40%), Bhutanese (2.3%, a difference of 0.62%), Paraguayan (2.3%, a difference of 0.90%), and Argentinean (2.3%, a difference of 1.1%).
| Demographics | Rating | Rank | Doctorate Degree |
| Immigrants | Czechoslovakia | 100.0 /100 | #56 | Exceptional 2.4% |
| Immigrants | Ethiopia | 100.0 /100 | #57 | Exceptional 2.4% |
| Ethiopians | 99.9 /100 | #58 | Exceptional 2.3% |
| South Africans | 99.9 /100 | #59 | Exceptional 2.3% |
| Immigrants | Serbia | 99.9 /100 | #60 | Exceptional 2.3% |
| Bhutanese | 99.9 /100 | #61 | Exceptional 2.3% |
| Immigrants | Europe | 99.9 /100 | #62 | Exceptional 2.3% |
| Laotians | 99.9 /100 | #63 | Exceptional 2.3% |
| Immigrants | Greece | 99.9 /100 | #64 | Exceptional 2.3% |
| Paraguayans | 99.9 /100 | #65 | Exceptional 2.3% |
| Argentineans | 99.9 /100 | #66 | Exceptional 2.3% |
| Zimbabweans | 99.8 /100 | #67 | Exceptional 2.3% |
| Immigrants | Kazakhstan | 99.8 /100 | #68 | Exceptional 2.3% |
| Carpatho Rusyns | 99.8 /100 | #69 | Exceptional 2.3% |
| Lithuanians | 99.8 /100 | #70 | Exceptional 2.3% |