Greek vs Immigrants from Honduras High School Diploma
COMPARE
Greek
Immigrants from Honduras
High School Diploma
High School Diploma Comparison
Greeks
Immigrants from Honduras
91.2%
HIGH SCHOOL DIPLOMA
99.8/ 100
METRIC RATING
46th/ 347
METRIC RANK
82.5%
HIGH SCHOOL DIPLOMA
0.0/ 100
METRIC RATING
332nd/ 347
METRIC RANK
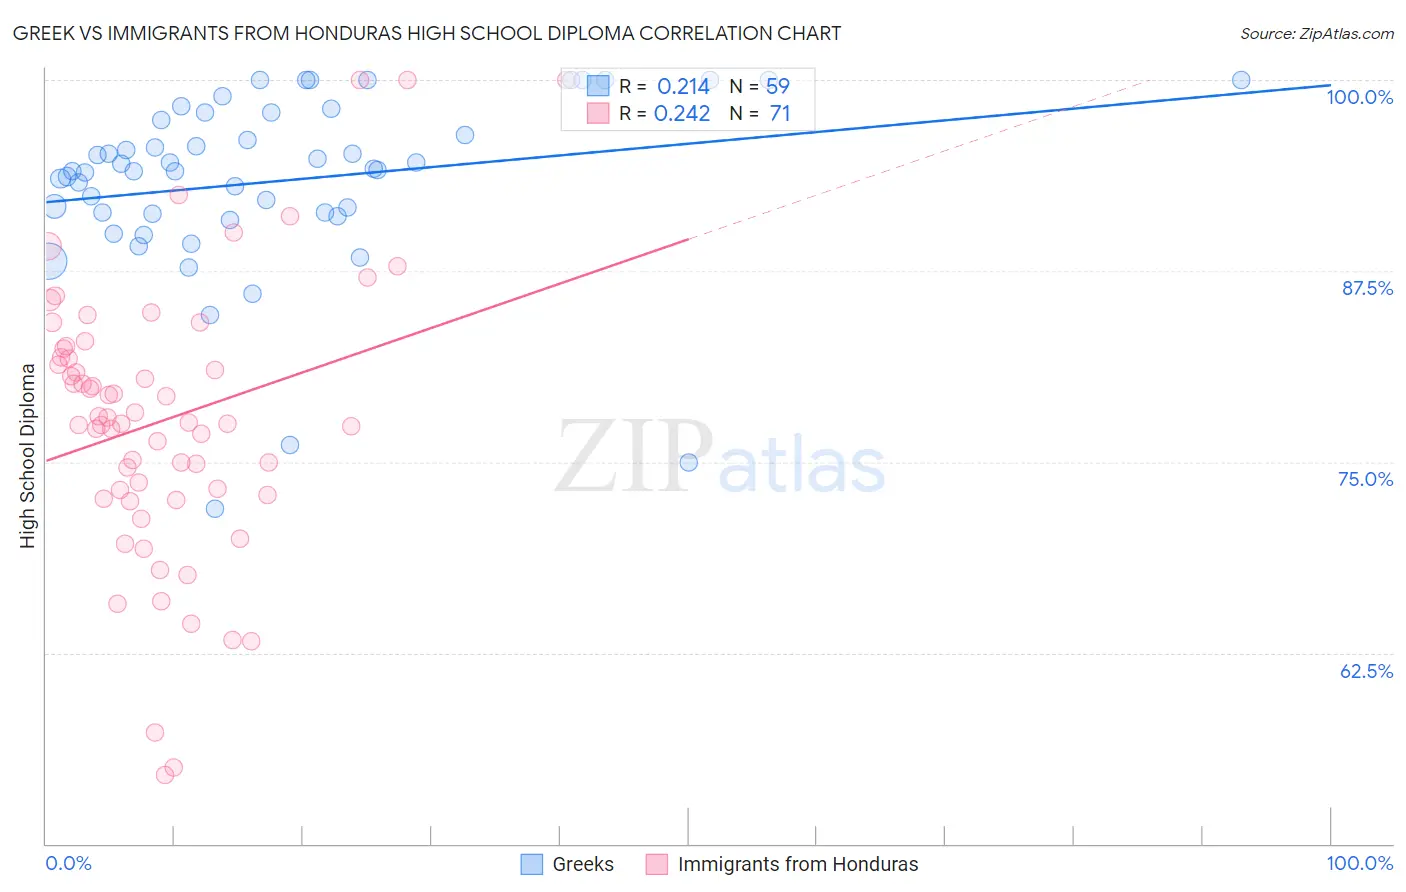
Greek vs Immigrants from Honduras High School Diploma Correlation Chart
The statistical analysis conducted on geographies consisting of 482,775,362 people shows a weak positive correlation between the proportion of Greeks and percentage of population with at least high school diploma education in the United States with a correlation coefficient (R) of 0.214 and weighted average of 91.2%. Similarly, the statistical analysis conducted on geographies consisting of 322,637,368 people shows a weak positive correlation between the proportion of Immigrants from Honduras and percentage of population with at least high school diploma education in the United States with a correlation coefficient (R) of 0.242 and weighted average of 82.5%, a difference of 10.6%.
High School Diploma Correlation Summary
| Measurement | Greek | Immigrants from Honduras |
| Minimum | 72.0% | 54.5% |
| Maximum | 100.0% | 100.0% |
| Range | 28.0% | 45.5% |
| Mean | 93.4% | 77.7% |
| Median | 94.1% | 77.6% |
| Interquartile 25% (IQ1) | 91.2% | 72.8% |
| Interquartile 75% (IQ3) | 97.9% | 82.4% |
| Interquartile Range (IQR) | 6.7% | 9.6% |
| Standard Deviation (Sample) | 5.9% | 9.1% |
| Standard Deviation (Population) | 5.9% | 9.1% |
Similar Demographics by High School Diploma
Demographics Similar to Greeks by High School Diploma
In terms of high school diploma, the demographic groups most similar to Greeks are Australian (91.2%, a difference of 0.010%), Belgian (91.2%, a difference of 0.020%), Bhutanese (91.2%, a difference of 0.020%), Turkish (91.2%, a difference of 0.030%), and Immigrants from Austria (91.3%, a difference of 0.040%).
| Demographics | Rating | Rank | High School Diploma |
| Dutch | 99.8 /100 | #39 | Exceptional 91.3% |
| Immigrants | Lithuania | 99.8 /100 | #40 | Exceptional 91.3% |
| Immigrants | Australia | 99.8 /100 | #41 | Exceptional 91.3% |
| Northern Europeans | 99.8 /100 | #42 | Exceptional 91.3% |
| British | 99.8 /100 | #43 | Exceptional 91.3% |
| Immigrants | Austria | 99.8 /100 | #44 | Exceptional 91.3% |
| Turks | 99.8 /100 | #45 | Exceptional 91.2% |
| Greeks | 99.8 /100 | #46 | Exceptional 91.2% |
| Australians | 99.8 /100 | #47 | Exceptional 91.2% |
| Belgians | 99.8 /100 | #48 | Exceptional 91.2% |
| Bhutanese | 99.8 /100 | #49 | Exceptional 91.2% |
| Welsh | 99.8 /100 | #50 | Exceptional 91.2% |
| New Zealanders | 99.7 /100 | #51 | Exceptional 91.1% |
| Immigrants | Sweden | 99.7 /100 | #52 | Exceptional 91.1% |
| Immigrants | Belgium | 99.7 /100 | #53 | Exceptional 91.1% |
Demographics Similar to Immigrants from Honduras by High School Diploma
In terms of high school diploma, the demographic groups most similar to Immigrants from Honduras are Central American (82.5%, a difference of 0.10%), Immigrants from Latin America (82.1%, a difference of 0.39%), Immigrants from the Azores (82.8%, a difference of 0.41%), Hispanic or Latino (82.9%, a difference of 0.49%), and Tohono O'odham (82.1%, a difference of 0.50%).
| Demographics | Rating | Rank | High School Diploma |
| Immigrants | Nicaragua | 0.0 /100 | #325 | Tragic 83.1% |
| Mexican American Indians | 0.0 /100 | #326 | Tragic 83.0% |
| Hondurans | 0.0 /100 | #327 | Tragic 83.0% |
| Dominicans | 0.0 /100 | #328 | Tragic 82.9% |
| Hispanics or Latinos | 0.0 /100 | #329 | Tragic 82.9% |
| Immigrants | Azores | 0.0 /100 | #330 | Tragic 82.8% |
| Central Americans | 0.0 /100 | #331 | Tragic 82.5% |
| Immigrants | Honduras | 0.0 /100 | #332 | Tragic 82.5% |
| Immigrants | Latin America | 0.0 /100 | #333 | Tragic 82.1% |
| Tohono O'odham | 0.0 /100 | #334 | Tragic 82.1% |
| Guatemalans | 0.0 /100 | #335 | Tragic 82.0% |
| Immigrants | Dominican Republic | 0.0 /100 | #336 | Tragic 82.0% |
| Immigrants | Yemen | 0.0 /100 | #337 | Tragic 81.8% |
| Salvadorans | 0.0 /100 | #338 | Tragic 81.7% |
| Pima | 0.0 /100 | #339 | Tragic 81.6% |