Iroquois vs Immigrants from Honduras High School Diploma
COMPARE
Iroquois
Immigrants from Honduras
High School Diploma
High School Diploma Comparison
Iroquois
Immigrants from Honduras
89.2%
HIGH SCHOOL DIPLOMA
55.1/ 100
METRIC RATING
169th/ 347
METRIC RANK
82.5%
HIGH SCHOOL DIPLOMA
0.0/ 100
METRIC RATING
332nd/ 347
METRIC RANK
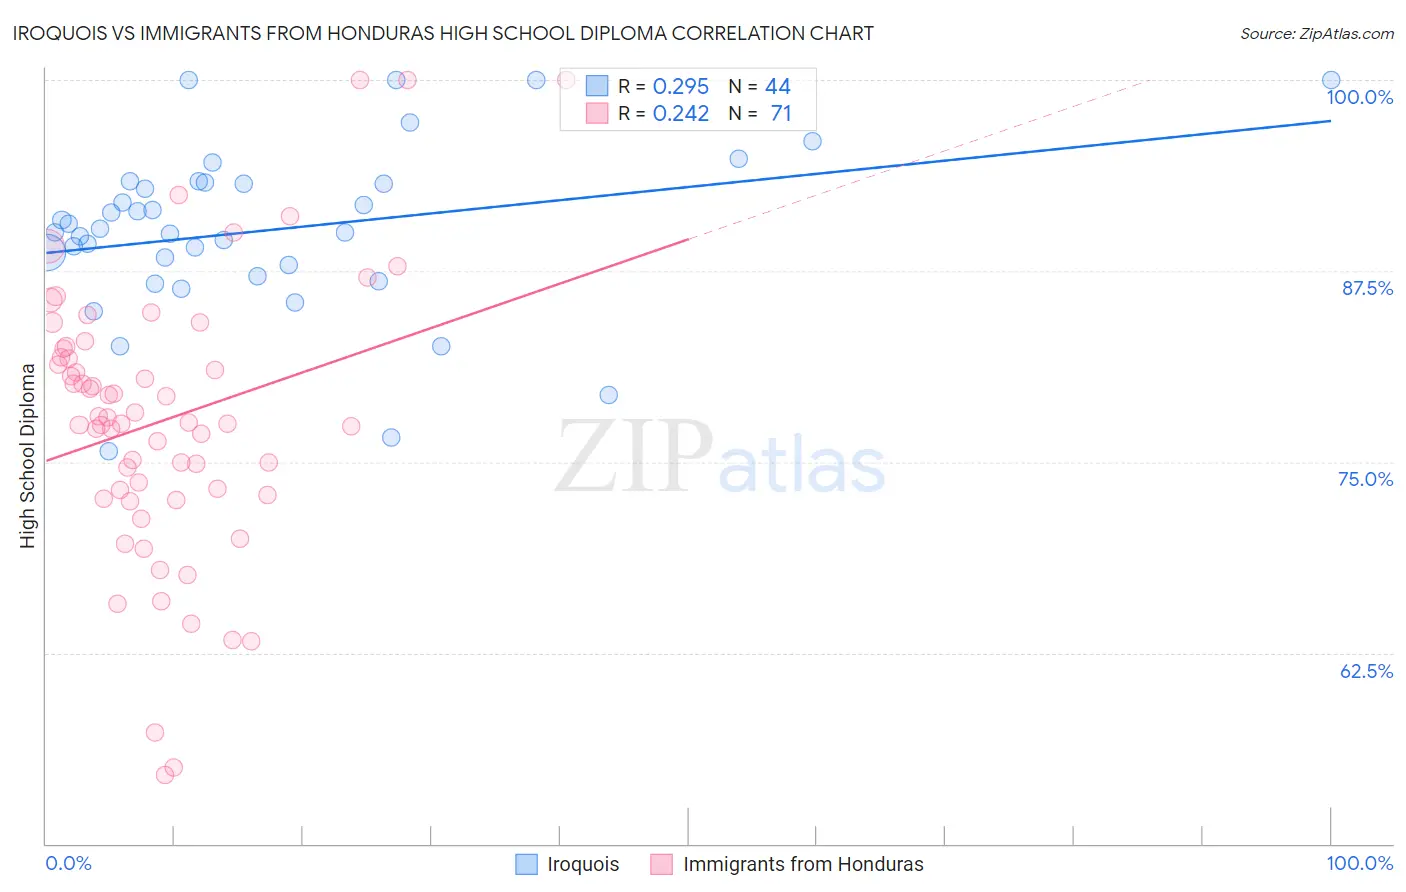
Iroquois vs Immigrants from Honduras High School Diploma Correlation Chart
The statistical analysis conducted on geographies consisting of 207,308,653 people shows a weak positive correlation between the proportion of Iroquois and percentage of population with at least high school diploma education in the United States with a correlation coefficient (R) of 0.295 and weighted average of 89.2%. Similarly, the statistical analysis conducted on geographies consisting of 322,637,368 people shows a weak positive correlation between the proportion of Immigrants from Honduras and percentage of population with at least high school diploma education in the United States with a correlation coefficient (R) of 0.242 and weighted average of 82.5%, a difference of 8.2%.
High School Diploma Correlation Summary
| Measurement | Iroquois | Immigrants from Honduras |
| Minimum | 75.7% | 54.5% |
| Maximum | 100.0% | 100.0% |
| Range | 24.3% | 45.5% |
| Mean | 90.2% | 77.7% |
| Median | 90.1% | 77.6% |
| Interquartile 25% (IQ1) | 87.5% | 72.8% |
| Interquartile 75% (IQ3) | 93.3% | 82.4% |
| Interquartile Range (IQR) | 5.7% | 9.6% |
| Standard Deviation (Sample) | 5.5% | 9.1% |
| Standard Deviation (Population) | 5.5% | 9.1% |
Similar Demographics by High School Diploma
Demographics Similar to Iroquois by High School Diploma
In terms of high school diploma, the demographic groups most similar to Iroquois are Delaware (89.2%, a difference of 0.010%), Immigrants from Morocco (89.2%, a difference of 0.030%), Spanish (89.2%, a difference of 0.030%), Immigrants from Hong Kong (89.3%, a difference of 0.050%), and Nonimmigrants (89.2%, a difference of 0.050%).
| Demographics | Rating | Rank | High School Diploma |
| Bermudans | 61.1 /100 | #162 | Good 89.3% |
| Cree | 61.1 /100 | #163 | Good 89.3% |
| Immigrants | Nepal | 61.1 /100 | #164 | Good 89.3% |
| Immigrants | Asia | 59.8 /100 | #165 | Average 89.3% |
| Immigrants | Albania | 59.4 /100 | #166 | Average 89.3% |
| Immigrants | Hong Kong | 58.6 /100 | #167 | Average 89.3% |
| Delaware | 55.8 /100 | #168 | Average 89.2% |
| Iroquois | 55.1 /100 | #169 | Average 89.2% |
| Immigrants | Morocco | 53.3 /100 | #170 | Average 89.2% |
| Spanish | 52.9 /100 | #171 | Average 89.2% |
| Immigrants | Nonimmigrants | 51.8 /100 | #172 | Average 89.2% |
| Immigrants | Indonesia | 50.3 /100 | #173 | Average 89.1% |
| Hmong | 50.0 /100 | #174 | Average 89.1% |
| Immigrants | Western Asia | 49.0 /100 | #175 | Average 89.1% |
| Osage | 48.9 /100 | #176 | Average 89.1% |
Demographics Similar to Immigrants from Honduras by High School Diploma
In terms of high school diploma, the demographic groups most similar to Immigrants from Honduras are Central American (82.5%, a difference of 0.10%), Immigrants from Latin America (82.1%, a difference of 0.39%), Immigrants from the Azores (82.8%, a difference of 0.41%), Hispanic or Latino (82.9%, a difference of 0.49%), and Tohono O'odham (82.1%, a difference of 0.50%).
| Demographics | Rating | Rank | High School Diploma |
| Immigrants | Nicaragua | 0.0 /100 | #325 | Tragic 83.1% |
| Mexican American Indians | 0.0 /100 | #326 | Tragic 83.0% |
| Hondurans | 0.0 /100 | #327 | Tragic 83.0% |
| Dominicans | 0.0 /100 | #328 | Tragic 82.9% |
| Hispanics or Latinos | 0.0 /100 | #329 | Tragic 82.9% |
| Immigrants | Azores | 0.0 /100 | #330 | Tragic 82.8% |
| Central Americans | 0.0 /100 | #331 | Tragic 82.5% |
| Immigrants | Honduras | 0.0 /100 | #332 | Tragic 82.5% |
| Immigrants | Latin America | 0.0 /100 | #333 | Tragic 82.1% |
| Tohono O'odham | 0.0 /100 | #334 | Tragic 82.1% |
| Guatemalans | 0.0 /100 | #335 | Tragic 82.0% |
| Immigrants | Dominican Republic | 0.0 /100 | #336 | Tragic 82.0% |
| Immigrants | Yemen | 0.0 /100 | #337 | Tragic 81.8% |
| Salvadorans | 0.0 /100 | #338 | Tragic 81.7% |
| Pima | 0.0 /100 | #339 | Tragic 81.6% |