Ghanaian vs Immigrants from Poland 9th Grade
COMPARE
Ghanaian
Immigrants from Poland
9th Grade
9th Grade Comparison
Ghanaians
Immigrants from Poland
93.9%
9TH GRADE
0.5/ 100
METRIC RATING
259th/ 347
METRIC RANK
94.9%
9TH GRADE
46.7/ 100
METRIC RATING
178th/ 347
METRIC RANK
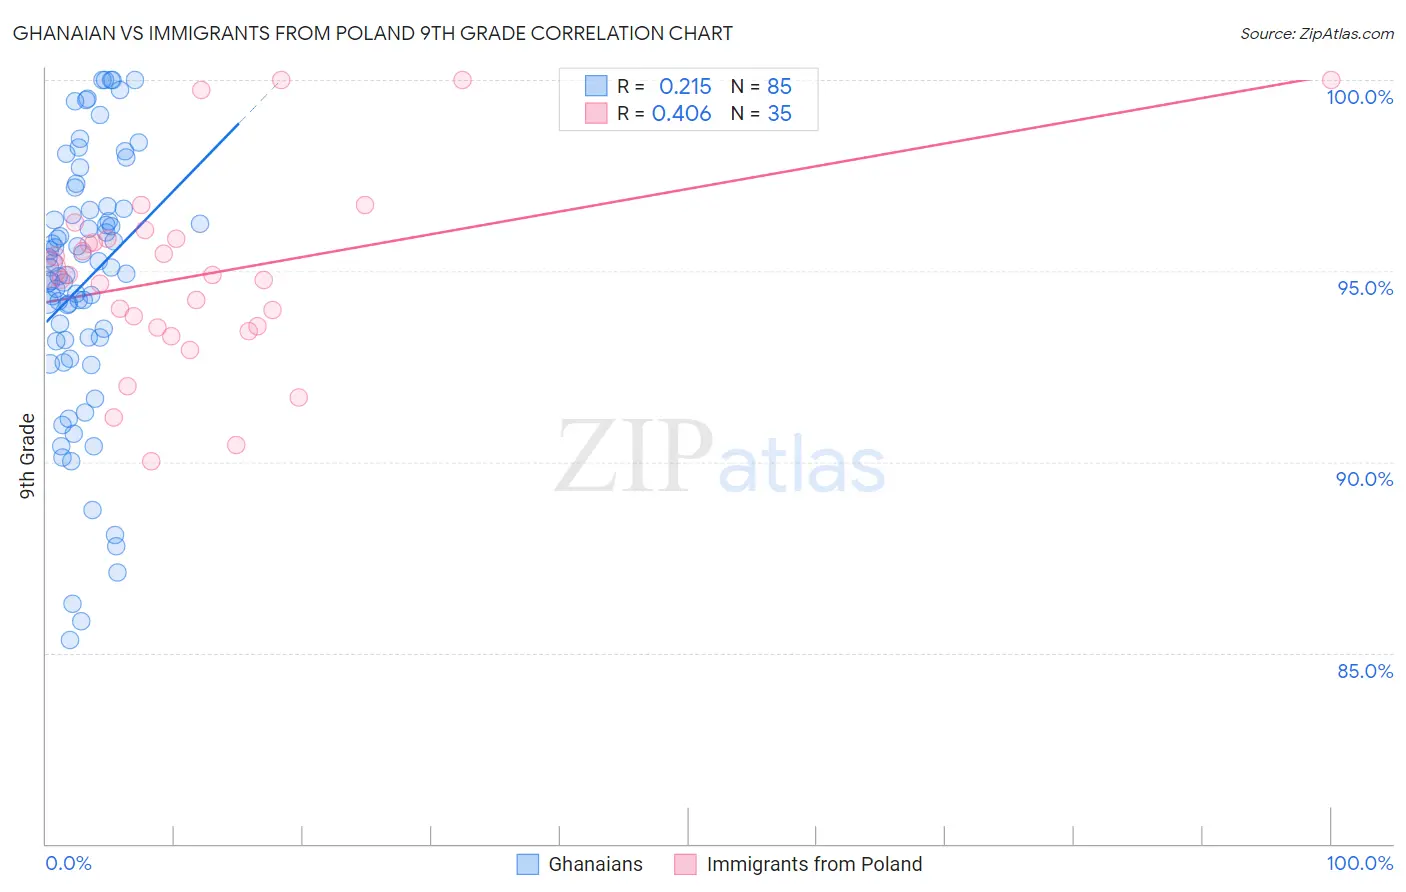
Ghanaian vs Immigrants from Poland 9th Grade Correlation Chart
The statistical analysis conducted on geographies consisting of 190,714,671 people shows a weak positive correlation between the proportion of Ghanaians and percentage of population with at least 9th grade education in the United States with a correlation coefficient (R) of 0.215 and weighted average of 93.9%. Similarly, the statistical analysis conducted on geographies consisting of 304,861,877 people shows a moderate positive correlation between the proportion of Immigrants from Poland and percentage of population with at least 9th grade education in the United States with a correlation coefficient (R) of 0.406 and weighted average of 94.9%, a difference of 0.96%.
9th Grade Correlation Summary
| Measurement | Ghanaian | Immigrants from Poland |
| Minimum | 85.3% | 90.0% |
| Maximum | 100.0% | 100.0% |
| Range | 14.7% | 10.0% |
| Mean | 94.7% | 94.9% |
| Median | 95.1% | 94.9% |
| Interquartile 25% (IQ1) | 93.2% | 93.5% |
| Interquartile 75% (IQ3) | 96.6% | 95.9% |
| Interquartile Range (IQR) | 3.4% | 2.3% |
| Standard Deviation (Sample) | 3.4% | 2.5% |
| Standard Deviation (Population) | 3.4% | 2.4% |
Similar Demographics by 9th Grade
Demographics Similar to Ghanaians by 9th Grade
In terms of 9th grade, the demographic groups most similar to Ghanaians are Immigrants from Thailand (93.9%, a difference of 0.0%), Immigrants from Costa Rica (94.0%, a difference of 0.010%), Pima (93.9%, a difference of 0.010%), Immigrants from Afghanistan (94.0%, a difference of 0.020%), and South American (93.9%, a difference of 0.020%).
| Demographics | Rating | Rank | 9th Grade |
| Immigrants | Senegal | 0.9 /100 | #252 | Tragic 94.1% |
| Colombians | 0.8 /100 | #253 | Tragic 94.0% |
| U.S. Virgin Islanders | 0.7 /100 | #254 | Tragic 94.0% |
| Immigrants | Nigeria | 0.6 /100 | #255 | Tragic 94.0% |
| Immigrants | Afghanistan | 0.5 /100 | #256 | Tragic 94.0% |
| Immigrants | Costa Rica | 0.5 /100 | #257 | Tragic 94.0% |
| Immigrants | Thailand | 0.5 /100 | #258 | Tragic 93.9% |
| Ghanaians | 0.5 /100 | #259 | Tragic 93.9% |
| Pima | 0.4 /100 | #260 | Tragic 93.9% |
| South Americans | 0.4 /100 | #261 | Tragic 93.9% |
| Immigrants | Jamaica | 0.4 /100 | #262 | Tragic 93.9% |
| Immigrants | Uzbekistan | 0.4 /100 | #263 | Tragic 93.9% |
| Immigrants | Congo | 0.4 /100 | #264 | Tragic 93.9% |
| Natives/Alaskans | 0.4 /100 | #265 | Tragic 93.9% |
| Navajo | 0.3 /100 | #266 | Tragic 93.9% |
Demographics Similar to Immigrants from Poland by 9th Grade
In terms of 9th grade, the demographic groups most similar to Immigrants from Poland are Immigrants from Venezuela (94.9%, a difference of 0.0%), Immigrants from Iraq (94.9%, a difference of 0.010%), Immigrants from Egypt (94.9%, a difference of 0.020%), Brazilian (94.9%, a difference of 0.020%), and Immigrants from Spain (94.9%, a difference of 0.020%).
| Demographics | Rating | Rank | 9th Grade |
| Colville | 58.5 /100 | #171 | Average 94.9% |
| Iraqis | 54.0 /100 | #172 | Average 94.9% |
| Cheyenne | 51.5 /100 | #173 | Average 94.9% |
| Immigrants | Egypt | 50.0 /100 | #174 | Average 94.9% |
| Brazilians | 49.8 /100 | #175 | Average 94.9% |
| Immigrants | Spain | 49.1 /100 | #176 | Average 94.9% |
| Immigrants | Iraq | 47.8 /100 | #177 | Average 94.9% |
| Immigrants | Poland | 46.7 /100 | #178 | Average 94.9% |
| Immigrants | Venezuela | 46.5 /100 | #179 | Average 94.9% |
| Immigrants | Uganda | 43.1 /100 | #180 | Average 94.8% |
| Sierra Leoneans | 42.7 /100 | #181 | Average 94.8% |
| Seminole | 42.5 /100 | #182 | Average 94.8% |
| Immigrants | Nepal | 39.7 /100 | #183 | Fair 94.8% |
| Argentineans | 37.6 /100 | #184 | Fair 94.8% |
| Liberians | 37.4 /100 | #185 | Fair 94.8% |