German vs Native Hawaiian Associate's Degree
COMPARE
German
Native Hawaiian
Associate's Degree
Associate's Degree Comparison
Germans
Native Hawaiians
45.5%
ASSOCIATE'S DEGREE
26.5/ 100
METRIC RATING
195th/ 347
METRIC RANK
43.1%
ASSOCIATE'S DEGREE
2.3/ 100
METRIC RATING
232nd/ 347
METRIC RANK
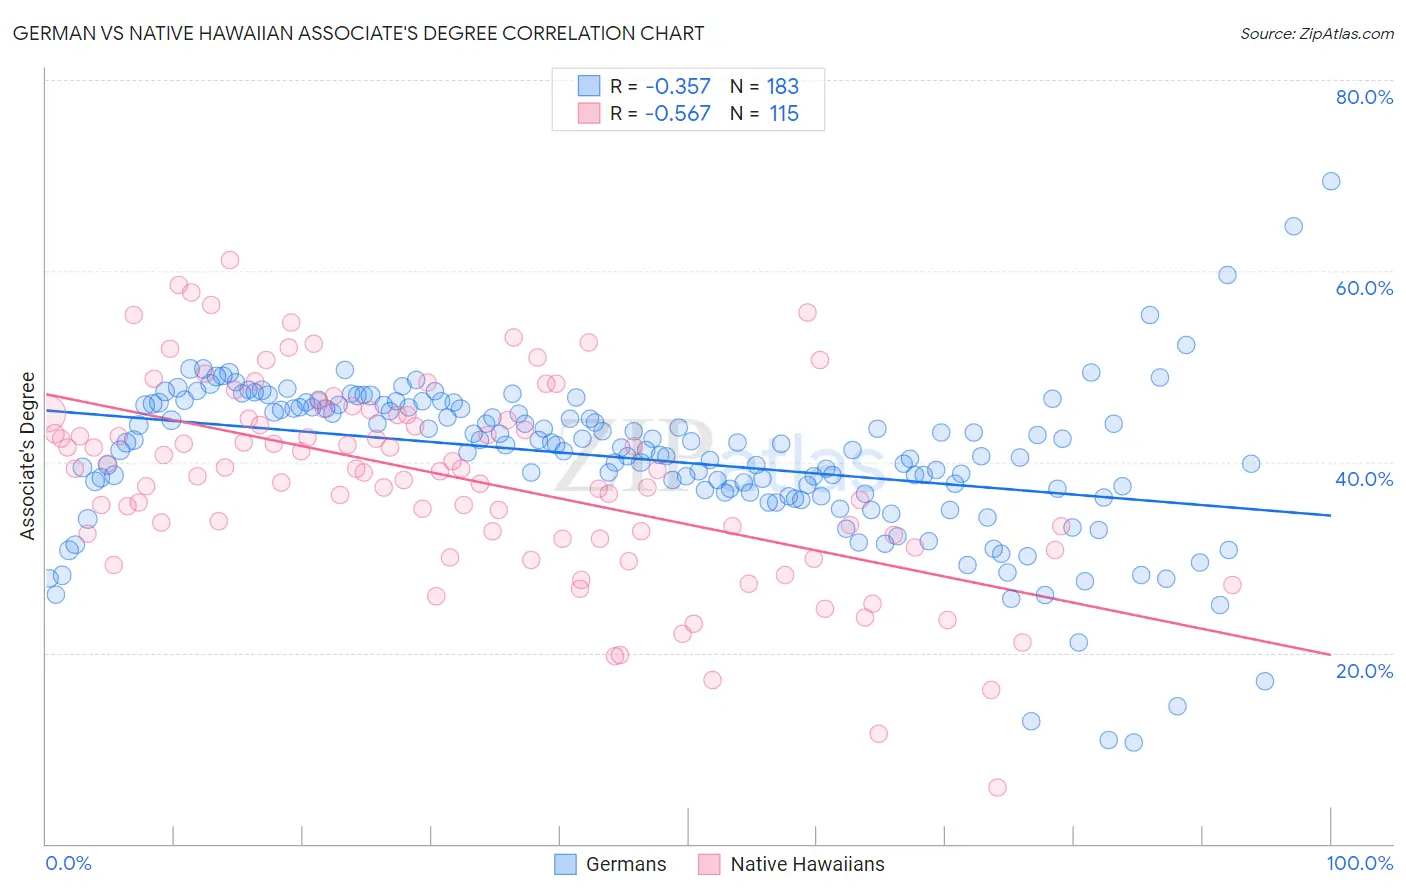
German vs Native Hawaiian Associate's Degree Correlation Chart
The statistical analysis conducted on geographies consisting of 581,143,634 people shows a mild negative correlation between the proportion of Germans and percentage of population with at least associate's degree education in the United States with a correlation coefficient (R) of -0.357 and weighted average of 45.5%. Similarly, the statistical analysis conducted on geographies consisting of 332,098,475 people shows a substantial negative correlation between the proportion of Native Hawaiians and percentage of population with at least associate's degree education in the United States with a correlation coefficient (R) of -0.567 and weighted average of 43.1%, a difference of 5.4%.
Associate's Degree Correlation Summary
| Measurement | German | Native Hawaiian |
| Minimum | 10.6% | 5.9% |
| Maximum | 69.4% | 61.2% |
| Range | 58.8% | 55.3% |
| Mean | 40.3% | 38.4% |
| Median | 41.8% | 39.3% |
| Interquartile 25% (IQ1) | 36.7% | 32.3% |
| Interquartile 75% (IQ3) | 45.9% | 44.9% |
| Interquartile Range (IQR) | 9.2% | 12.6% |
| Standard Deviation (Sample) | 8.3% | 10.3% |
| Standard Deviation (Population) | 8.3% | 10.3% |
Similar Demographics by Associate's Degree
Demographics Similar to Germans by Associate's Degree
In terms of associate's degree, the demographic groups most similar to Germans are French (45.4%, a difference of 0.090%), Immigrants from Peru (45.5%, a difference of 0.10%), Immigrants from Cameroon (45.7%, a difference of 0.42%), Scotch-Irish (45.3%, a difference of 0.44%), and Immigrants from Bangladesh (45.2%, a difference of 0.54%).
| Demographics | Rating | Rank | Associate's Degree |
| Ghanaians | 35.5 /100 | #188 | Fair 45.8% |
| Immigrants | Oceania | 34.7 /100 | #189 | Fair 45.8% |
| Vietnamese | 34.0 /100 | #190 | Fair 45.8% |
| Koreans | 33.8 /100 | #191 | Fair 45.8% |
| Celtics | 33.3 /100 | #192 | Fair 45.8% |
| Immigrants | Cameroon | 31.0 /100 | #193 | Fair 45.7% |
| Immigrants | Peru | 27.6 /100 | #194 | Fair 45.5% |
| Germans | 26.5 /100 | #195 | Fair 45.5% |
| French | 25.6 /100 | #196 | Fair 45.4% |
| Scotch-Irish | 22.3 /100 | #197 | Fair 45.3% |
| Immigrants | Bangladesh | 21.3 /100 | #198 | Fair 45.2% |
| Immigrants | Senegal | 21.2 /100 | #199 | Fair 45.2% |
| Senegalese | 21.1 /100 | #200 | Fair 45.2% |
| Immigrants | Vietnam | 20.8 /100 | #201 | Fair 45.2% |
| Spaniards | 20.4 /100 | #202 | Fair 45.2% |
Demographics Similar to Native Hawaiians by Associate's Degree
In terms of associate's degree, the demographic groups most similar to Native Hawaiians are Tongan (43.0%, a difference of 0.16%), Tlingit-Haida (43.0%, a difference of 0.25%), Ecuadorian (43.0%, a difference of 0.35%), Immigrants from Barbados (43.3%, a difference of 0.43%), and Liberian (43.3%, a difference of 0.43%).
| Demographics | Rating | Rank | Associate's Degree |
| Guamanians/Chamorros | 4.8 /100 | #225 | Tragic 43.8% |
| Immigrants | Burma/Myanmar | 4.3 /100 | #226 | Tragic 43.7% |
| Trinidadians and Tobagonians | 4.0 /100 | #227 | Tragic 43.6% |
| Hmong | 3.2 /100 | #228 | Tragic 43.4% |
| Immigrants | Trinidad and Tobago | 3.0 /100 | #229 | Tragic 43.3% |
| Immigrants | Barbados | 2.9 /100 | #230 | Tragic 43.3% |
| Liberians | 2.9 /100 | #231 | Tragic 43.3% |
| Native Hawaiians | 2.3 /100 | #232 | Tragic 43.1% |
| Tongans | 2.2 /100 | #233 | Tragic 43.0% |
| Tlingit-Haida | 2.1 /100 | #234 | Tragic 43.0% |
| Ecuadorians | 2.0 /100 | #235 | Tragic 43.0% |
| Immigrants | St. Vincent and the Grenadines | 1.9 /100 | #236 | Tragic 42.9% |
| Immigrants | Nonimmigrants | 1.9 /100 | #237 | Tragic 42.9% |
| Iroquois | 1.7 /100 | #238 | Tragic 42.8% |
| Immigrants | Grenada | 1.3 /100 | #239 | Tragic 42.6% |