German vs Carpatho Rusyn Associate's Degree

COMPARE

German
Race
Ancestry
AfghanAfricanAlaska NativeAlaskan AthabascanAlbanianAleutAlsatianAmericanApacheArabArapahoArgentineanArmenianAssyrian/Chaldean/SyriacAustralianAustrianBahamianBangladeshiBarbadianBasqueBelgianBelizeanBermudanBhutaneseBlackfeetBolivianBrazilianBritishBritish West IndianBulgarianBurmeseCajunCambodianCanadianCape VerdeanCelticCentral AmericanCentral American IndianCherokeeCheyenneChickasawChileanChineseChippewaChoctawColombianColvilleComancheCosta RicanCreeCreekCroatianCrowCubanCypriotCzechCzechoslovakianDanishDelawareDominicanDutchDutch West IndianEastern EuropeanEcuadorianEgyptianEnglishEstonianEthiopianEuropeanFijianFilipinoFinnishFrenchFrench American IndianFrench CanadianGermanGerman RussianGhanaianGreekGuamanian/ChamorroGuatemalanGuyaneseHaitianHmongHonduranHopiHoumaHungarianIcelanderIndian (Asian)IndonesianInupiatIranianIraqiIrishIroquoisIsraeliItalianJamaicanJapaneseJordanianKenyanKiowaKoreanLaotianLatvianLebaneseLiberianLithuanianLumbeeLuxembourgerMacedonianMalaysianMalteseMarshalleseMenomineeMexicanMexican American IndianMongolianMoroccanNative HawaiianNavajoNepaleseNew ZealanderNicaraguanNigerianNorthern EuropeanNorwegianOkinawanOsageOttawaPaiutePakistaniPalestinianPanamanianParaguayanPennsylvania GermanPeruvianPimaPolishPortuguesePotawatomiPuebloPuerto RicanPuget Sound SalishRomanianRussianSalvadoranSamoanScandinavianScotch-IrishScottishSeminoleSenegaleseSerbianShoshoneSierra LeoneanSiouxSlavicSlovakSloveneSomaliSouth AfricanSouth AmericanSouth American IndianSoviet UnionSpaniardSpanishSpanish AmericanSpanish American IndianSri LankanSubsaharan AfricanSudaneseSwedishSwissSyrianTaiwaneseThaiTlingit-HaidaTohono O'OdhamTonganTrinidadian and TobagonianTsimshianTurkishU.S. Virgin IslanderUgandanUkrainianUruguayanUteVenezuelanVietnameseWelshWest IndianYakamaYaquiYugoslavianYumanYup'ikZimbabwean
Immigration
NonimmigrantsImmigrantsAfghanistanAfricaAlbaniaArgentinaArmeniaAsiaAustraliaAustriaBahamasBangladeshBarbadosBelarusBelgiumBelizeBoliviaBosnia and HerzegovinaBrazilBulgariaBurma/MyanmarCabo VerdeCambodiaCameroonCanadaCaribbeanCentral AmericaChileChinaColombiaCongoCosta RicaCroatiaCubaCzechoslovakiaDenmarkDominicaDominican RepublicEastern AfricaEastern AsiaEastern EuropeEcuadorEgyptEl SalvadorEnglandEritreaEthiopiaEuropeFijiFranceGermanyGhanaGreeceGrenadaGuatemalaGuyanaHaitiHondurasHong KongHungaryIndiaIndonesiaIranIraqIrelandIsraelItalyJamaicaJapanJordanKazakhstanKenyaKoreaKuwaitLaosLatin AmericaLatviaLebanonLiberiaLithuaniaMalaysiaMexicoMicronesiaMiddle AfricaMoldovaMoroccoNepalNetherlandsNicaraguaNigeriaNorth AmericaNorth MacedoniaNorthern AfricaNorthern EuropeNorwayOceaniaPakistanPanamaPeruPhilippinesPolandPortugalRomaniaRussiaSaudi ArabiaScotlandSenegalSerbiaSierra LeoneSingaporeSomaliaSouth AfricaSouth AmericaSouth Central AsiaSouth Eastern AsiaSouthern EuropeSpainSri LankaSt. Vincent and the GrenadinesSudanSwedenSwitzerlandSyriaTaiwanThailandTrinidad and TobagoTurkeyUgandaUkraineUruguayUzbekistanVenezuelaVietnamWest IndiesWestern AfricaWestern AsiaWestern EuropeYemenZaireZimbabweAzores
Carpatho Rusyn
Race
Ancestry
AfghanAfricanAlaska NativeAlaskan AthabascanAlbanianAleutAlsatianAmericanApacheArabArapahoArgentineanArmenianAssyrian/Chaldean/SyriacAustralianAustrianBahamianBangladeshiBarbadianBasqueBelgianBelizeanBermudanBhutaneseBlackfeetBolivianBrazilianBritishBritish West IndianBulgarianBurmeseCajunCambodianCanadianCape VerdeanCarpatho RusynCelticCentral AmericanCentral American IndianCherokeeCheyenneChickasawChileanChineseChippewaChoctawColombianColvilleComancheCosta RicanCreeCreekCroatianCrowCubanCypriotCzechCzechoslovakianDanishDelawareDominicanDutchDutch West IndianEastern EuropeanEcuadorianEgyptianEnglishEstonianEthiopianEuropeanFijianFilipinoFinnishFrenchFrench American IndianFrench CanadianGerman RussianGhanaianGreekGuamanian/ChamorroGuatemalanGuyaneseHaitianHmongHonduranHopiHoumaHungarianIcelanderIndian (Asian)IndonesianInupiatIranianIraqiIrishIroquoisIsraeliItalianJamaicanJapaneseJordanianKenyanKiowaKoreanLaotianLatvianLebaneseLiberianLithuanianLumbeeLuxembourgerMacedonianMalaysianMalteseMarshalleseMenomineeMexicanMexican American IndianMongolianMoroccanNative HawaiianNavajoNepaleseNew ZealanderNicaraguanNigerianNorthern EuropeanNorwegianOkinawanOsageOttawaPaiutePakistaniPalestinianPanamanianParaguayanPennsylvania GermanPeruvianPimaPolishPortuguesePotawatomiPuebloPuerto RicanPuget Sound SalishRomanianRussianSalvadoranSamoanScandinavianScotch-IrishScottishSeminoleSenegaleseSerbianShoshoneSierra LeoneanSiouxSlavicSlovakSloveneSomaliSouth AfricanSouth AmericanSouth American IndianSoviet UnionSpaniardSpanishSpanish AmericanSpanish American IndianSri LankanSubsaharan AfricanSudaneseSwedishSwissSyrianTaiwaneseThaiTlingit-HaidaTohono O'OdhamTonganTrinidadian and TobagonianTsimshianTurkishU.S. Virgin IslanderUgandanUkrainianUruguayanUteVenezuelanVietnameseWelshWest IndianYakamaYaquiYugoslavianYumanYup'ikZimbabwean
Immigration
NonimmigrantsImmigrantsAfghanistanAfricaAlbaniaArgentinaArmeniaAsiaAustraliaAustriaBahamasBangladeshBarbadosBelarusBelgiumBelizeBoliviaBosnia and HerzegovinaBrazilBulgariaBurma/MyanmarCabo VerdeCambodiaCameroonCanadaCaribbeanCentral AmericaChileChinaColombiaCongoCosta RicaCroatiaCubaCzechoslovakiaDenmarkDominicaDominican RepublicEastern AfricaEastern AsiaEastern EuropeEcuadorEgyptEl SalvadorEnglandEritreaEthiopiaEuropeFijiFranceGermanyGhanaGreeceGrenadaGuatemalaGuyanaHaitiHondurasHong KongHungaryIndiaIndonesiaIranIraqIrelandIsraelItalyJamaicaJapanJordanKazakhstanKenyaKoreaKuwaitLaosLatin AmericaLatviaLebanonLiberiaLithuaniaMalaysiaMexicoMicronesiaMiddle AfricaMoldovaMoroccoNepalNetherlandsNicaraguaNigeriaNorth AmericaNorth MacedoniaNorthern AfricaNorthern EuropeNorwayOceaniaPakistanPanamaPeruPhilippinesPolandPortugalRomaniaRussiaSaudi ArabiaScotlandSenegalSerbiaSierra LeoneSingaporeSomaliaSouth AfricaSouth AmericaSouth Central AsiaSouth Eastern AsiaSouthern EuropeSpainSri LankaSt. Vincent and the GrenadinesSudanSwedenSwitzerlandSyriaTaiwanThailandTrinidad and TobagoTurkeyUgandaUkraineUruguayUzbekistanVenezuelaVietnamWest IndiesWestern AfricaWestern AsiaWestern EuropeYemenZaireZimbabweAzores
Associate's Degree
Income
Poverty
Unemployment
Labor Participation
Family Structure
Vehicle Availability
Education Level
Disability

Associate's Degree Comparison

Germans

Carpatho Rusyns

Fair
Exceptional
45.5%
ASSOCIATE'S DEGREE
26.5/ 100
METRIC RATING
195th/ 347
METRIC RANK
50.6%
ASSOCIATE'S DEGREE
99.3/ 100
METRIC RATING
73rd/ 347
METRIC RANK

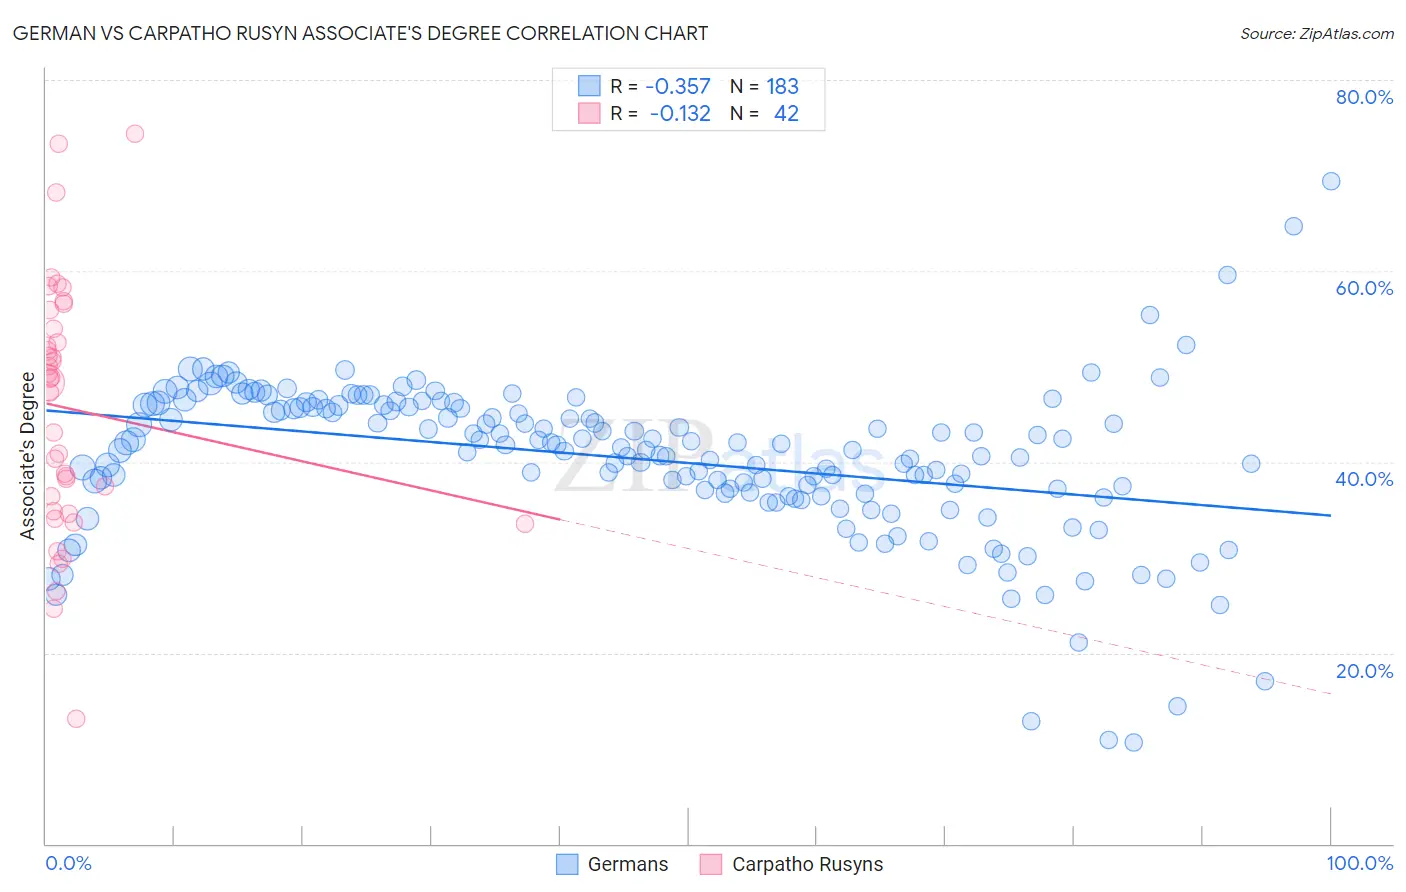
German vs Carpatho Rusyn Associate's Degree Correlation Chart

The statistical analysis conducted on geographies consisting of 581,143,634 people shows a mild negative correlation between the proportion of Germans and percentage of population with at least associate's degree education in the United States with a correlation coefficient (R) of -0.357 and weighted average of 45.5%. Similarly, the statistical analysis conducted on geographies consisting of 58,871,690 people shows a poor negative correlation between the proportion of Carpatho Rusyns and percentage of population with at least associate's degree education in the United States with a correlation coefficient (R) of -0.132 and weighted average of 50.6%, a difference of 11.4%.
German vs Carpatho Rusyn Associate's Degree

Associate's Degree Correlation Summary

MeasurementGermanCarpatho Rusyn
Minimum10.6%13.2%
Maximum69.4%74.4%
Range58.8%61.2%
Mean40.3%45.6%
Median41.8%48.5%
Interquartile 25% (IQ1)36.7%34.9%
Interquartile 75% (IQ3)45.9%53.9%
Interquartile Range (IQR)9.2%19.0%
Standard Deviation (Sample)8.3%13.2%
Standard Deviation (Population)8.3%13.0%

Similar Demographics by Associate's Degree

Demographics Similar to Germans by Associate's Degree

In terms of associate's degree, the demographic groups most similar to Germans are French (45.4%, a difference of 0.090%), Immigrants from Peru (45.5%, a difference of 0.10%), Immigrants from Cameroon (45.7%, a difference of 0.42%), Scotch-Irish (45.3%, a difference of 0.44%), and Immigrants from Bangladesh (45.2%, a difference of 0.54%).
DemographicsRating | RankAssociate's Degree
Ghanaians
35.5
/100
|
#188
Fair
45.8%
Immigrants | Oceania
34.7
/100
|
#189
Fair
45.8%
Vietnamese
34.0
/100
|
#190
Fair
45.8%
Koreans
33.8
/100
|
#191
Fair
45.8%
Celtics
33.3
/100
|
#192
Fair
45.8%
Immigrants | Cameroon
31.0
/100
|
#193
Fair
45.7%
Immigrants | Peru
27.6
/100
|
#194
Fair
45.5%
Germans
26.5
/100
|
#195
Fair
45.5%
French
25.6
/100
|
#196
Fair
45.4%
Scotch-Irish
22.3
/100
|
#197
Fair
45.3%
Immigrants | Bangladesh
21.3
/100
|
#198
Fair
45.2%
Immigrants | Senegal
21.2
/100
|
#199
Fair
45.2%
Senegalese
21.1
/100
|
#200
Fair
45.2%
Immigrants | Vietnam
20.8
/100
|
#201
Fair
45.2%
Spaniards
20.4
/100
|
#202
Fair
45.2%

Demographics Similar to Carpatho Rusyns by Associate's Degree

In terms of associate's degree, the demographic groups most similar to Carpatho Rusyns are Lithuanian (50.6%, a difference of 0.060%), Immigrants from Scotland (50.6%, a difference of 0.10%), Immigrants from Zimbabwe (50.5%, a difference of 0.31%), Immigrants from Lebanon (50.5%, a difference of 0.34%), and Immigrants from Eastern Europe (50.5%, a difference of 0.38%).
DemographicsRating | RankAssociate's Degree
Immigrants | Europe
99.7
/100
|
#66
Exceptional
51.3%
Argentineans
99.6
/100
|
#67
Exceptional
51.2%
Immigrants | Indonesia
99.5
/100
|
#68
Exceptional
51.0%
Egyptians
99.5
/100
|
#69
Exceptional
50.9%
Immigrants | Argentina
99.5
/100
|
#70
Exceptional
50.9%
Immigrants | Romania
99.5
/100
|
#71
Exceptional
50.9%
Immigrants | Pakistan
99.5
/100
|
#72
Exceptional
50.9%
Carpatho Rusyns
99.3
/100
|
#73
Exceptional
50.6%
Lithuanians
99.3
/100
|
#74
Exceptional
50.6%
Immigrants | Scotland
99.3
/100
|
#75
Exceptional
50.6%
Immigrants | Zimbabwe
99.2
/100
|
#76
Exceptional
50.5%
Immigrants | Lebanon
99.1
/100
|
#77
Exceptional
50.5%
Immigrants | Eastern Europe
99.1
/100
|
#78
Exceptional
50.5%
Ethiopians
99.1
/100
|
#79
Exceptional
50.4%
Armenians
99.1
/100
|
#80
Exceptional
50.4%