German vs Estonian Associate's Degree
COMPARE
German
Estonian
Associate's Degree
Associate's Degree Comparison
Germans
Estonians
45.5%
ASSOCIATE'S DEGREE
26.5/ 100
METRIC RATING
195th/ 347
METRIC RANK
52.5%
ASSOCIATE'S DEGREE
99.9/ 100
METRIC RATING
44th/ 347
METRIC RANK
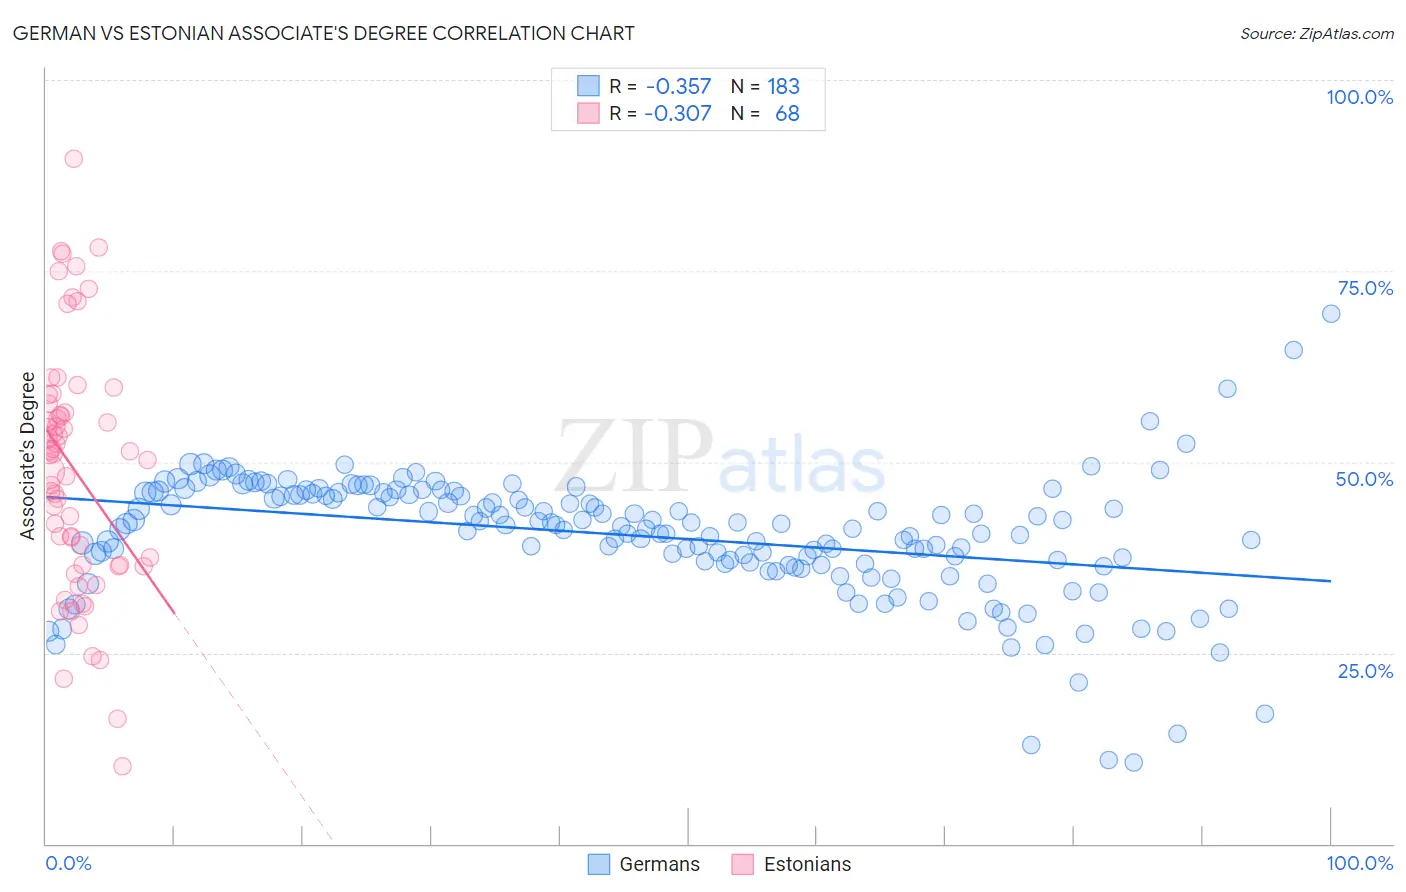
German vs Estonian Associate's Degree Correlation Chart
The statistical analysis conducted on geographies consisting of 581,143,634 people shows a mild negative correlation between the proportion of Germans and percentage of population with at least associate's degree education in the United States with a correlation coefficient (R) of -0.357 and weighted average of 45.5%. Similarly, the statistical analysis conducted on geographies consisting of 123,528,324 people shows a mild negative correlation between the proportion of Estonians and percentage of population with at least associate's degree education in the United States with a correlation coefficient (R) of -0.307 and weighted average of 52.5%, a difference of 15.4%.
Associate's Degree Correlation Summary
| Measurement | German | Estonian |
| Minimum | 10.6% | 10.2% |
| Maximum | 69.4% | 89.7% |
| Range | 58.8% | 79.5% |
| Mean | 40.3% | 49.0% |
| Median | 41.8% | 51.0% |
| Interquartile 25% (IQ1) | 36.7% | 36.5% |
| Interquartile 75% (IQ3) | 45.9% | 57.1% |
| Interquartile Range (IQR) | 9.2% | 20.5% |
| Standard Deviation (Sample) | 8.3% | 16.0% |
| Standard Deviation (Population) | 8.3% | 15.9% |
Similar Demographics by Associate's Degree
Demographics Similar to Germans by Associate's Degree
In terms of associate's degree, the demographic groups most similar to Germans are French (45.4%, a difference of 0.090%), Immigrants from Peru (45.5%, a difference of 0.10%), Immigrants from Cameroon (45.7%, a difference of 0.42%), Scotch-Irish (45.3%, a difference of 0.44%), and Immigrants from Bangladesh (45.2%, a difference of 0.54%).
| Demographics | Rating | Rank | Associate's Degree |
| Ghanaians | 35.5 /100 | #188 | Fair 45.8% |
| Immigrants | Oceania | 34.7 /100 | #189 | Fair 45.8% |
| Vietnamese | 34.0 /100 | #190 | Fair 45.8% |
| Koreans | 33.8 /100 | #191 | Fair 45.8% |
| Celtics | 33.3 /100 | #192 | Fair 45.8% |
| Immigrants | Cameroon | 31.0 /100 | #193 | Fair 45.7% |
| Immigrants | Peru | 27.6 /100 | #194 | Fair 45.5% |
| Germans | 26.5 /100 | #195 | Fair 45.5% |
| French | 25.6 /100 | #196 | Fair 45.4% |
| Scotch-Irish | 22.3 /100 | #197 | Fair 45.3% |
| Immigrants | Bangladesh | 21.3 /100 | #198 | Fair 45.2% |
| Immigrants | Senegal | 21.2 /100 | #199 | Fair 45.2% |
| Senegalese | 21.1 /100 | #200 | Fair 45.2% |
| Immigrants | Vietnam | 20.8 /100 | #201 | Fair 45.2% |
| Spaniards | 20.4 /100 | #202 | Fair 45.2% |
Demographics Similar to Estonians by Associate's Degree
In terms of associate's degree, the demographic groups most similar to Estonians are Immigrants from Lithuania (52.4%, a difference of 0.080%), Immigrants from South Africa (52.5%, a difference of 0.090%), Immigrants from Malaysia (52.5%, a difference of 0.10%), Immigrants from Saudi Arabia (52.6%, a difference of 0.13%), and Immigrants from Bulgaria (52.4%, a difference of 0.21%).
| Demographics | Rating | Rank | Associate's Degree |
| Immigrants | Denmark | 100.0 /100 | #37 | Exceptional 53.1% |
| Mongolians | 100.0 /100 | #38 | Exceptional 53.0% |
| Immigrants | Belarus | 99.9 /100 | #39 | Exceptional 52.8% |
| Immigrants | Latvia | 99.9 /100 | #40 | Exceptional 52.8% |
| Immigrants | Saudi Arabia | 99.9 /100 | #41 | Exceptional 52.6% |
| Immigrants | Malaysia | 99.9 /100 | #42 | Exceptional 52.5% |
| Immigrants | South Africa | 99.9 /100 | #43 | Exceptional 52.5% |
| Estonians | 99.9 /100 | #44 | Exceptional 52.5% |
| Immigrants | Lithuania | 99.9 /100 | #45 | Exceptional 52.4% |
| Immigrants | Bulgaria | 99.9 /100 | #46 | Exceptional 52.4% |
| Immigrants | Kuwait | 99.9 /100 | #47 | Exceptional 52.4% |
| Immigrants | Norway | 99.9 /100 | #48 | Exceptional 52.2% |
| Immigrants | Austria | 99.9 /100 | #49 | Exceptional 52.1% |
| Asians | 99.9 /100 | #50 | Exceptional 52.1% |
| Immigrants | Greece | 99.9 /100 | #51 | Exceptional 52.1% |