German Russian vs Immigrants from Asia Bachelor's Degree
COMPARE
German Russian
Immigrants from Asia
Bachelor's Degree
Bachelor's Degree Comparison
German Russians
Immigrants from Asia
35.8%
BACHELOR'S DEGREE
10.2/ 100
METRIC RATING
217th/ 347
METRIC RANK
44.3%
BACHELOR'S DEGREE
99.9/ 100
METRIC RATING
53rd/ 347
METRIC RANK
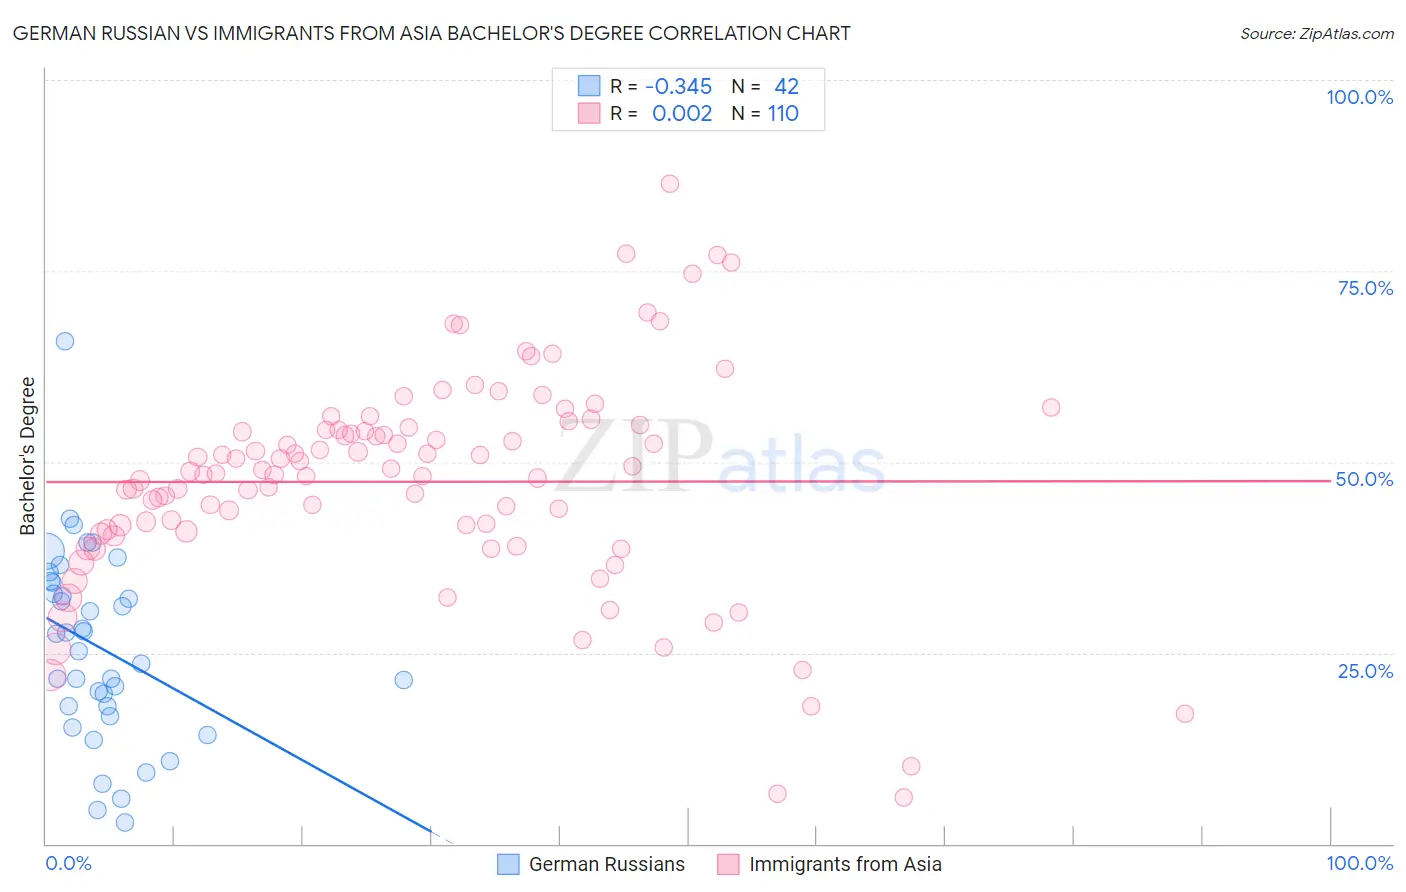
German Russian vs Immigrants from Asia Bachelor's Degree Correlation Chart
The statistical analysis conducted on geographies consisting of 96,460,010 people shows a mild negative correlation between the proportion of German Russians and percentage of population with at least bachelor's degree education in the United States with a correlation coefficient (R) of -0.345 and weighted average of 35.8%. Similarly, the statistical analysis conducted on geographies consisting of 549,058,309 people shows no correlation between the proportion of Immigrants from Asia and percentage of population with at least bachelor's degree education in the United States with a correlation coefficient (R) of 0.002 and weighted average of 44.3%, a difference of 23.6%.
Bachelor's Degree Correlation Summary
| Measurement | German Russian | Immigrants from Asia |
| Minimum | 2.8% | 6.0% |
| Maximum | 65.8% | 86.4% |
| Range | 63.0% | 80.4% |
| Mean | 25.7% | 47.4% |
| Median | 26.4% | 48.6% |
| Interquartile 25% (IQ1) | 18.0% | 40.9% |
| Interquartile 75% (IQ3) | 34.3% | 54.2% |
| Interquartile Range (IQR) | 16.3% | 13.3% |
| Standard Deviation (Sample) | 12.5% | 14.2% |
| Standard Deviation (Population) | 12.3% | 14.1% |
Similar Demographics by Bachelor's Degree
Demographics Similar to German Russians by Bachelor's Degree
In terms of bachelor's degree, the demographic groups most similar to German Russians are Subsaharan African (35.8%, a difference of 0.10%), West Indian (35.8%, a difference of 0.13%), Spanish (35.8%, a difference of 0.17%), Dutch (35.7%, a difference of 0.28%), and Trinidadian and Tobagonian (35.7%, a difference of 0.42%).
| Demographics | Rating | Rank | Bachelor's Degree |
| French | 18.6 /100 | #210 | Poor 36.5% |
| Scotch-Irish | 18.3 /100 | #211 | Poor 36.4% |
| Immigrants | Philippines | 17.8 /100 | #212 | Poor 36.4% |
| Immigrants | Panama | 14.2 /100 | #213 | Poor 36.2% |
| Germans | 13.9 /100 | #214 | Poor 36.1% |
| Immigrants | Western Africa | 13.8 /100 | #215 | Poor 36.1% |
| Barbadians | 13.5 /100 | #216 | Poor 36.1% |
| German Russians | 10.2 /100 | #217 | Poor 35.8% |
| Sub-Saharan Africans | 9.8 /100 | #218 | Tragic 35.8% |
| West Indians | 9.7 /100 | #219 | Tragic 35.8% |
| Spanish | 9.6 /100 | #220 | Tragic 35.8% |
| Dutch | 9.2 /100 | #221 | Tragic 35.7% |
| Trinidadians and Tobagonians | 8.8 /100 | #222 | Tragic 35.7% |
| French Canadians | 8.3 /100 | #223 | Tragic 35.6% |
| Immigrants | Barbados | 7.5 /100 | #224 | Tragic 35.5% |
Demographics Similar to Immigrants from Asia by Bachelor's Degree
In terms of bachelor's degree, the demographic groups most similar to Immigrants from Asia are Immigrants from Spain (44.3%, a difference of 0.060%), Immigrants from Austria (44.2%, a difference of 0.19%), Immigrants from Bolivia (44.2%, a difference of 0.19%), Asian (44.4%, a difference of 0.24%), and Immigrants from Serbia (44.1%, a difference of 0.37%).
| Demographics | Rating | Rank | Bachelor's Degree |
| Immigrants | Bulgaria | 99.9 /100 | #46 | Exceptional 44.6% |
| Bolivians | 99.9 /100 | #47 | Exceptional 44.6% |
| Estonians | 99.9 /100 | #48 | Exceptional 44.6% |
| Immigrants | Norway | 99.9 /100 | #49 | Exceptional 44.5% |
| Immigrants | Greece | 99.9 /100 | #50 | Exceptional 44.5% |
| Asians | 99.9 /100 | #51 | Exceptional 44.4% |
| Immigrants | Spain | 99.9 /100 | #52 | Exceptional 44.3% |
| Immigrants | Asia | 99.9 /100 | #53 | Exceptional 44.3% |
| Immigrants | Austria | 99.9 /100 | #54 | Exceptional 44.2% |
| Immigrants | Bolivia | 99.9 /100 | #55 | Exceptional 44.2% |
| Immigrants | Serbia | 99.9 /100 | #56 | Exceptional 44.1% |
| Paraguayans | 99.9 /100 | #57 | Exceptional 44.0% |
| Immigrants | Czechoslovakia | 99.9 /100 | #58 | Exceptional 44.0% |
| Australians | 99.9 /100 | #59 | Exceptional 44.0% |
| New Zealanders | 99.9 /100 | #60 | Exceptional 44.0% |