German Russian vs Nigerian Bachelor's Degree
COMPARE
German Russian
Nigerian
Bachelor's Degree
Bachelor's Degree Comparison
German Russians
Nigerians
35.8%
BACHELOR'S DEGREE
10.2/ 100
METRIC RATING
217th/ 347
METRIC RANK
37.2%
BACHELOR'S DEGREE
33.9/ 100
METRIC RATING
191st/ 347
METRIC RANK
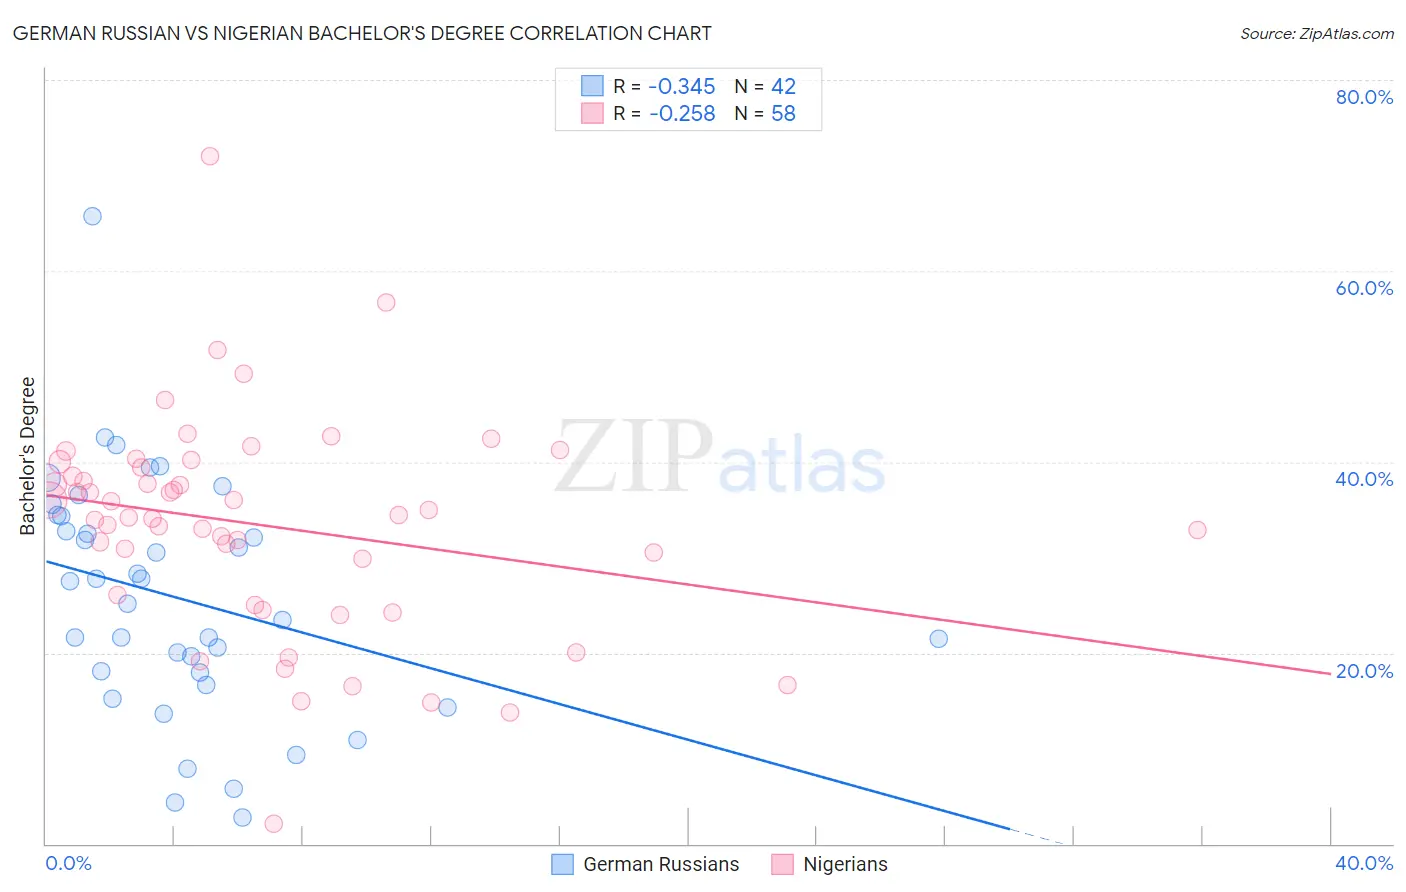
German Russian vs Nigerian Bachelor's Degree Correlation Chart
The statistical analysis conducted on geographies consisting of 96,460,010 people shows a mild negative correlation between the proportion of German Russians and percentage of population with at least bachelor's degree education in the United States with a correlation coefficient (R) of -0.345 and weighted average of 35.8%. Similarly, the statistical analysis conducted on geographies consisting of 332,744,449 people shows a weak negative correlation between the proportion of Nigerians and percentage of population with at least bachelor's degree education in the United States with a correlation coefficient (R) of -0.258 and weighted average of 37.2%, a difference of 3.9%.
Bachelor's Degree Correlation Summary
| Measurement | German Russian | Nigerian |
| Minimum | 2.8% | 2.0% |
| Maximum | 65.8% | 72.0% |
| Range | 63.0% | 70.0% |
| Mean | 25.7% | 33.4% |
| Median | 26.4% | 34.3% |
| Interquartile 25% (IQ1) | 18.0% | 26.1% |
| Interquartile 75% (IQ3) | 34.3% | 39.4% |
| Interquartile Range (IQR) | 16.3% | 13.3% |
| Standard Deviation (Sample) | 12.5% | 11.4% |
| Standard Deviation (Population) | 12.3% | 11.3% |
Similar Demographics by Bachelor's Degree
Demographics Similar to German Russians by Bachelor's Degree
In terms of bachelor's degree, the demographic groups most similar to German Russians are Subsaharan African (35.8%, a difference of 0.10%), West Indian (35.8%, a difference of 0.13%), Spanish (35.8%, a difference of 0.17%), Dutch (35.7%, a difference of 0.28%), and Trinidadian and Tobagonian (35.7%, a difference of 0.42%).
| Demographics | Rating | Rank | Bachelor's Degree |
| French | 18.6 /100 | #210 | Poor 36.5% |
| Scotch-Irish | 18.3 /100 | #211 | Poor 36.4% |
| Immigrants | Philippines | 17.8 /100 | #212 | Poor 36.4% |
| Immigrants | Panama | 14.2 /100 | #213 | Poor 36.2% |
| Germans | 13.9 /100 | #214 | Poor 36.1% |
| Immigrants | Western Africa | 13.8 /100 | #215 | Poor 36.1% |
| Barbadians | 13.5 /100 | #216 | Poor 36.1% |
| German Russians | 10.2 /100 | #217 | Poor 35.8% |
| Sub-Saharan Africans | 9.8 /100 | #218 | Tragic 35.8% |
| West Indians | 9.7 /100 | #219 | Tragic 35.8% |
| Spanish | 9.6 /100 | #220 | Tragic 35.8% |
| Dutch | 9.2 /100 | #221 | Tragic 35.7% |
| Trinidadians and Tobagonians | 8.8 /100 | #222 | Tragic 35.7% |
| French Canadians | 8.3 /100 | #223 | Tragic 35.6% |
| Immigrants | Barbados | 7.5 /100 | #224 | Tragic 35.5% |
Demographics Similar to Nigerians by Bachelor's Degree
In terms of bachelor's degree, the demographic groups most similar to Nigerians are Swiss (37.2%, a difference of 0.020%), Immigrants from Vietnam (37.1%, a difference of 0.20%), Yugoslavian (37.1%, a difference of 0.27%), Slovak (37.3%, a difference of 0.32%), and Immigrants from Oceania (37.3%, a difference of 0.37%).
| Demographics | Rating | Rank | Bachelor's Degree |
| Scandinavians | 41.7 /100 | #184 | Average 37.5% |
| Immigrants | Peru | 41.3 /100 | #185 | Average 37.5% |
| Norwegians | 40.4 /100 | #186 | Average 37.5% |
| English | 39.7 /100 | #187 | Fair 37.4% |
| Immigrants | Oceania | 37.3 /100 | #188 | Fair 37.3% |
| Slovaks | 36.9 /100 | #189 | Fair 37.3% |
| Swiss | 34.1 /100 | #190 | Fair 37.2% |
| Nigerians | 33.9 /100 | #191 | Fair 37.2% |
| Immigrants | Vietnam | 32.1 /100 | #192 | Fair 37.1% |
| Yugoslavians | 31.5 /100 | #193 | Fair 37.1% |
| Belgians | 29.9 /100 | #194 | Fair 37.0% |
| Koreans | 29.8 /100 | #195 | Fair 37.0% |
| Celtics | 29.5 /100 | #196 | Fair 37.0% |
| Czechoslovakians | 29.2 /100 | #197 | Fair 37.0% |
| Welsh | 29.1 /100 | #198 | Fair 37.0% |