Immigrants from Northern Europe vs Immigrants from Asia Bachelor's Degree
COMPARE
Immigrants from Northern Europe
Immigrants from Asia
Bachelor's Degree
Bachelor's Degree Comparison
Immigrants from Northern Europe
Immigrants from Asia
45.6%
BACHELOR'S DEGREE
100.0/ 100
METRIC RATING
33rd/ 347
METRIC RANK
44.3%
BACHELOR'S DEGREE
99.9/ 100
METRIC RATING
53rd/ 347
METRIC RANK
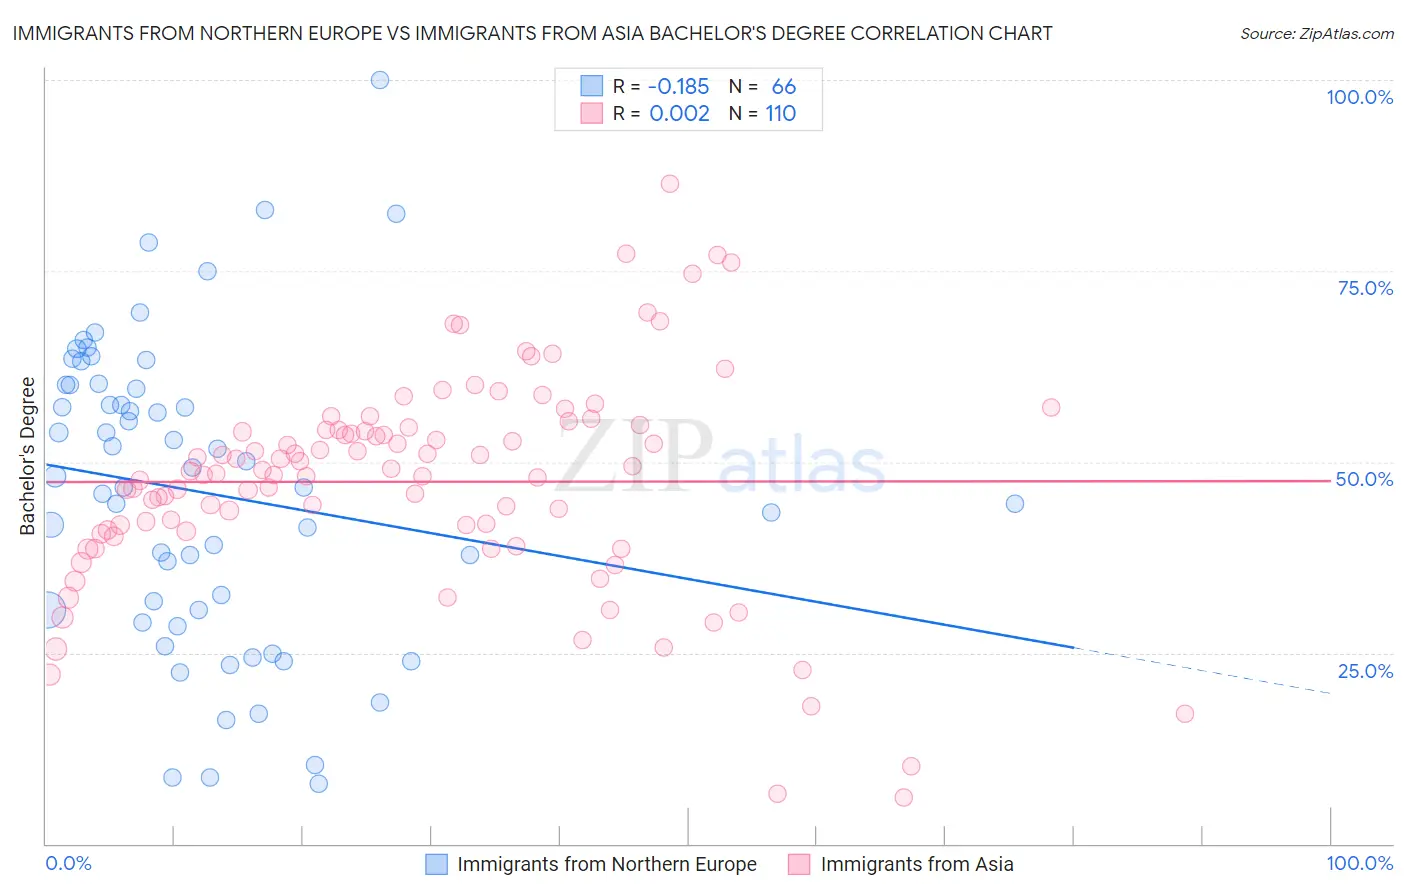
Immigrants from Northern Europe vs Immigrants from Asia Bachelor's Degree Correlation Chart
The statistical analysis conducted on geographies consisting of 477,184,497 people shows a poor negative correlation between the proportion of Immigrants from Northern Europe and percentage of population with at least bachelor's degree education in the United States with a correlation coefficient (R) of -0.185 and weighted average of 45.6%. Similarly, the statistical analysis conducted on geographies consisting of 549,058,309 people shows no correlation between the proportion of Immigrants from Asia and percentage of population with at least bachelor's degree education in the United States with a correlation coefficient (R) of 0.002 and weighted average of 44.3%, a difference of 3.0%.
Bachelor's Degree Correlation Summary
| Measurement | Immigrants from Northern Europe | Immigrants from Asia |
| Minimum | 7.8% | 6.0% |
| Maximum | 100.0% | 86.4% |
| Range | 92.2% | 80.4% |
| Mean | 46.0% | 47.4% |
| Median | 47.4% | 48.6% |
| Interquartile 25% (IQ1) | 30.6% | 40.9% |
| Interquartile 75% (IQ3) | 60.1% | 54.2% |
| Interquartile Range (IQR) | 29.5% | 13.3% |
| Standard Deviation (Sample) | 20.0% | 14.2% |
| Standard Deviation (Population) | 19.8% | 14.1% |
Demographics Similar to Immigrants from Northern Europe and Immigrants from Asia by Bachelor's Degree
In terms of bachelor's degree, the demographic groups most similar to Immigrants from Northern Europe are Immigrants from Denmark (45.4%, a difference of 0.45%), Immigrants from Russia (45.4%, a difference of 0.48%), Mongolian (45.4%, a difference of 0.50%), Russian (45.3%, a difference of 0.65%), and Bulgarian (45.3%, a difference of 0.74%). Similarly, the demographic groups most similar to Immigrants from Asia are Immigrants from Spain (44.3%, a difference of 0.060%), Asian (44.4%, a difference of 0.24%), Immigrants from Greece (44.5%, a difference of 0.38%), Immigrants from Norway (44.5%, a difference of 0.49%), and Bolivian (44.6%, a difference of 0.62%).
| Demographics | Rating | Rank | Bachelor's Degree |
| Immigrants | Northern Europe | 100.0 /100 | #33 | Exceptional 45.6% |
| Immigrants | Denmark | 100.0 /100 | #34 | Exceptional 45.4% |
| Immigrants | Russia | 100.0 /100 | #35 | Exceptional 45.4% |
| Mongolians | 100.0 /100 | #36 | Exceptional 45.4% |
| Russians | 100.0 /100 | #37 | Exceptional 45.3% |
| Bulgarians | 100.0 /100 | #38 | Exceptional 45.3% |
| Immigrants | Latvia | 100.0 /100 | #39 | Exceptional 45.1% |
| Immigrants | Belarus | 100.0 /100 | #40 | Exceptional 45.0% |
| Immigrants | Malaysia | 100.0 /100 | #41 | Exceptional 45.0% |
| Immigrants | Saudi Arabia | 100.0 /100 | #42 | Exceptional 44.8% |
| Immigrants | South Africa | 99.9 /100 | #43 | Exceptional 44.8% |
| Immigrants | Lithuania | 99.9 /100 | #44 | Exceptional 44.6% |
| Immigrants | Kuwait | 99.9 /100 | #45 | Exceptional 44.6% |
| Immigrants | Bulgaria | 99.9 /100 | #46 | Exceptional 44.6% |
| Bolivians | 99.9 /100 | #47 | Exceptional 44.6% |
| Estonians | 99.9 /100 | #48 | Exceptional 44.6% |
| Immigrants | Norway | 99.9 /100 | #49 | Exceptional 44.5% |
| Immigrants | Greece | 99.9 /100 | #50 | Exceptional 44.5% |
| Asians | 99.9 /100 | #51 | Exceptional 44.4% |
| Immigrants | Spain | 99.9 /100 | #52 | Exceptional 44.3% |
| Immigrants | Asia | 99.9 /100 | #53 | Exceptional 44.3% |