Fijian vs Immigrants from Poland High School Diploma
COMPARE
Fijian
Immigrants from Poland
High School Diploma
High School Diploma Comparison
Fijians
Immigrants from Poland
86.0%
HIGH SCHOOL DIPLOMA
0.0/ 100
METRIC RATING
290th/ 347
METRIC RANK
89.5%
HIGH SCHOOL DIPLOMA
72.9/ 100
METRIC RATING
149th/ 347
METRIC RANK
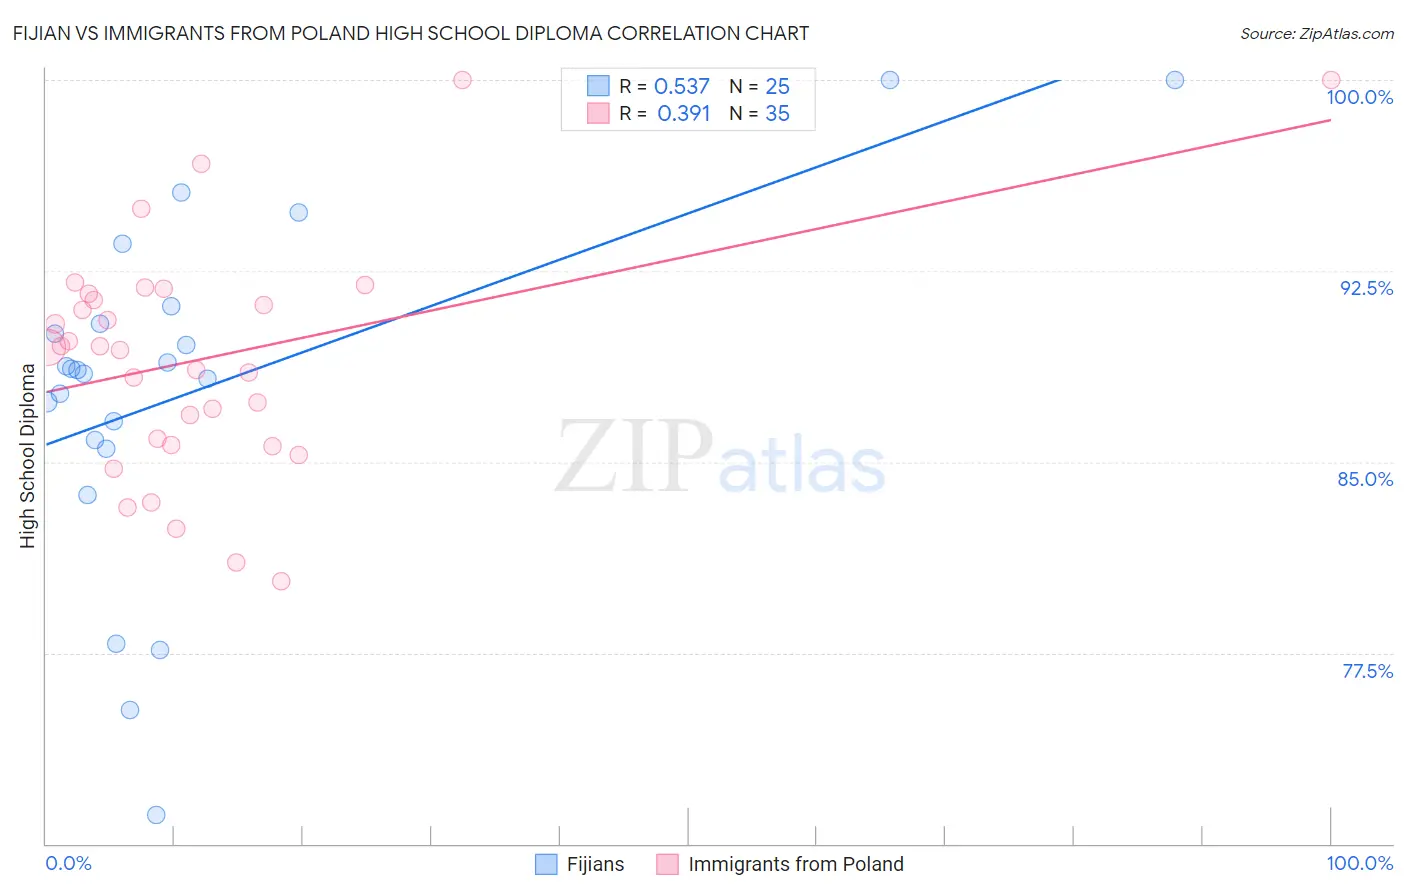
Fijian vs Immigrants from Poland High School Diploma Correlation Chart
The statistical analysis conducted on geographies consisting of 55,948,842 people shows a substantial positive correlation between the proportion of Fijians and percentage of population with at least high school diploma education in the United States with a correlation coefficient (R) of 0.537 and weighted average of 86.0%. Similarly, the statistical analysis conducted on geographies consisting of 304,861,877 people shows a mild positive correlation between the proportion of Immigrants from Poland and percentage of population with at least high school diploma education in the United States with a correlation coefficient (R) of 0.391 and weighted average of 89.5%, a difference of 4.1%.
High School Diploma Correlation Summary
| Measurement | Fijian | Immigrants from Poland |
| Minimum | 71.1% | 80.3% |
| Maximum | 100.0% | 100.0% |
| Range | 28.9% | 19.7% |
| Mean | 87.8% | 89.1% |
| Median | 88.6% | 89.5% |
| Interquartile 25% (IQ1) | 85.7% | 85.7% |
| Interquartile 75% (IQ3) | 90.8% | 91.6% |
| Interquartile Range (IQR) | 5.1% | 5.9% |
| Standard Deviation (Sample) | 6.9% | 4.6% |
| Standard Deviation (Population) | 6.7% | 4.5% |
Similar Demographics by High School Diploma
Demographics Similar to Fijians by High School Diploma
In terms of high school diploma, the demographic groups most similar to Fijians are Yup'ik (86.1%, a difference of 0.070%), Haitian (85.9%, a difference of 0.13%), Japanese (85.9%, a difference of 0.14%), British West Indian (85.9%, a difference of 0.16%), and Ute (86.2%, a difference of 0.18%).
| Demographics | Rating | Rank | High School Diploma |
| Immigrants | Barbados | 0.0 /100 | #283 | Tragic 86.4% |
| Paiute | 0.0 /100 | #284 | Tragic 86.4% |
| Immigrants | West Indies | 0.0 /100 | #285 | Tragic 86.2% |
| Immigrants | St. Vincent and the Grenadines | 0.0 /100 | #286 | Tragic 86.2% |
| Ute | 0.0 /100 | #287 | Tragic 86.2% |
| Immigrants | Vietnam | 0.0 /100 | #288 | Tragic 86.2% |
| Yup'ik | 0.0 /100 | #289 | Tragic 86.1% |
| Fijians | 0.0 /100 | #290 | Tragic 86.0% |
| Haitians | 0.0 /100 | #291 | Tragic 85.9% |
| Japanese | 0.0 /100 | #292 | Tragic 85.9% |
| British West Indians | 0.0 /100 | #293 | Tragic 85.9% |
| Immigrants | Fiji | 0.0 /100 | #294 | Tragic 85.8% |
| Immigrants | Immigrants | 0.0 /100 | #295 | Tragic 85.8% |
| Immigrants | Cambodia | 0.0 /100 | #296 | Tragic 85.6% |
| Immigrants | Grenada | 0.0 /100 | #297 | Tragic 85.6% |
Demographics Similar to Immigrants from Poland by High School Diploma
In terms of high school diploma, the demographic groups most similar to Immigrants from Poland are Immigrants from Lebanon (89.5%, a difference of 0.010%), Argentinean (89.5%, a difference of 0.010%), Iraqi (89.5%, a difference of 0.020%), Paraguayan (89.5%, a difference of 0.030%), and Asian (89.4%, a difference of 0.040%).
| Demographics | Rating | Rank | High School Diploma |
| Indians (Asian) | 78.8 /100 | #142 | Good 89.6% |
| Pakistanis | 78.3 /100 | #143 | Good 89.6% |
| Immigrants | Kenya | 78.0 /100 | #144 | Good 89.6% |
| Immigrants | Brazil | 76.6 /100 | #145 | Good 89.5% |
| Immigrants | Spain | 76.2 /100 | #146 | Good 89.5% |
| Iraqis | 73.9 /100 | #147 | Good 89.5% |
| Immigrants | Lebanon | 73.4 /100 | #148 | Good 89.5% |
| Immigrants | Poland | 72.9 /100 | #149 | Good 89.5% |
| Argentineans | 72.3 /100 | #150 | Good 89.5% |
| Paraguayans | 71.4 /100 | #151 | Good 89.5% |
| Asians | 70.7 /100 | #152 | Good 89.4% |
| Immigrants | Iraq | 68.7 /100 | #153 | Good 89.4% |
| Alsatians | 66.8 /100 | #154 | Good 89.4% |
| Immigrants | Northern Africa | 66.4 /100 | #155 | Good 89.4% |
| Immigrants | Argentina | 65.5 /100 | #156 | Good 89.4% |