Egyptian vs Ottawa 6th Grade
COMPARE
Egyptian
Ottawa
6th Grade
6th Grade Comparison
Egyptians
Ottawa
97.1%
6TH GRADE
50.9/ 100
METRIC RATING
172nd/ 347
METRIC RANK
98.5%
6TH GRADE
100.0/ 100
METRIC RATING
2nd/ 347
METRIC RANK
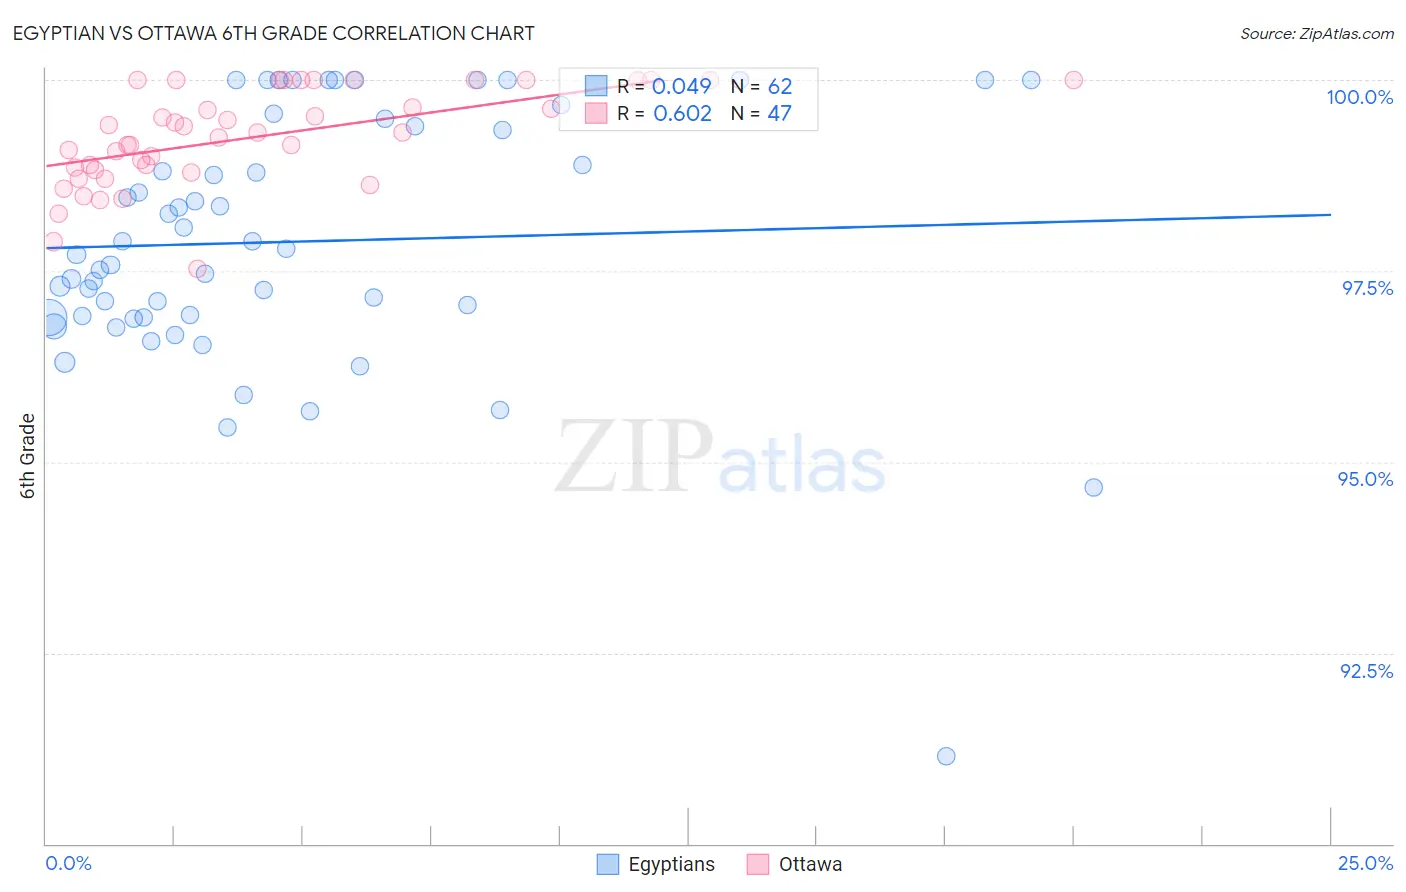
Egyptian vs Ottawa 6th Grade Correlation Chart
The statistical analysis conducted on geographies consisting of 276,927,423 people shows no correlation between the proportion of Egyptians and percentage of population with at least 6th grade education in the United States with a correlation coefficient (R) of 0.049 and weighted average of 97.1%. Similarly, the statistical analysis conducted on geographies consisting of 4,824,405 people shows a significant positive correlation between the proportion of Ottawa and percentage of population with at least 6th grade education in the United States with a correlation coefficient (R) of 0.602 and weighted average of 98.5%, a difference of 1.5%.
6th Grade Correlation Summary
| Measurement | Egyptian | Ottawa |
| Minimum | 91.1% | 97.5% |
| Maximum | 100.0% | 100.0% |
| Range | 8.9% | 2.5% |
| Mean | 97.9% | 99.3% |
| Median | 97.8% | 99.3% |
| Interquartile 25% (IQ1) | 96.9% | 98.8% |
| Interquartile 75% (IQ3) | 99.4% | 100.0% |
| Interquartile Range (IQR) | 2.5% | 1.2% |
| Standard Deviation (Sample) | 1.7% | 0.63% |
| Standard Deviation (Population) | 1.7% | 0.62% |
Similar Demographics by 6th Grade
Demographics Similar to Egyptians by 6th Grade
In terms of 6th grade, the demographic groups most similar to Egyptians are Immigrants from Sri Lanka (97.1%, a difference of 0.0%), Arab (97.0%, a difference of 0.0%), Venezuelan (97.0%, a difference of 0.0%), Immigrants from Italy (97.1%, a difference of 0.010%), and Apache (97.1%, a difference of 0.010%).
| Demographics | Rating | Rank | 6th Grade |
| Immigrants | Poland | 56.2 /100 | #165 | Average 97.1% |
| Immigrants | Italy | 53.8 /100 | #166 | Average 97.1% |
| Apache | 53.6 /100 | #167 | Average 97.1% |
| Immigrants | Taiwan | 53.5 /100 | #168 | Average 97.1% |
| Bermudans | 52.6 /100 | #169 | Average 97.1% |
| Chileans | 52.1 /100 | #170 | Average 97.1% |
| Immigrants | Sri Lanka | 51.7 /100 | #171 | Average 97.1% |
| Egyptians | 50.9 /100 | #172 | Average 97.1% |
| Arabs | 50.1 /100 | #173 | Average 97.0% |
| Venezuelans | 50.0 /100 | #174 | Average 97.0% |
| Immigrants | Kazakhstan | 47.3 /100 | #175 | Average 97.0% |
| Immigrants | Micronesia | 47.1 /100 | #176 | Average 97.0% |
| Mongolians | 46.7 /100 | #177 | Average 97.0% |
| Pakistanis | 46.0 /100 | #178 | Average 97.0% |
| Immigrants | Kenya | 45.3 /100 | #179 | Average 97.0% |
Demographics Similar to Ottawa by 6th Grade
In terms of 6th grade, the demographic groups most similar to Ottawa are Welsh (98.5%, a difference of 0.010%), Dutch (98.4%, a difference of 0.14%), Tsimshian (98.3%, a difference of 0.21%), Norwegian (98.3%, a difference of 0.21%), and German (98.2%, a difference of 0.25%).
| Demographics | Rating | Rank | 6th Grade |
| Crow | 100.0 /100 | #1 | Exceptional 99.4% |
| Ottawa | 100.0 /100 | #2 | Exceptional 98.5% |
| Welsh | 100.0 /100 | #3 | Exceptional 98.5% |
| Dutch | 100.0 /100 | #4 | Exceptional 98.4% |
| Tsimshian | 100.0 /100 | #5 | Exceptional 98.3% |
| Norwegians | 100.0 /100 | #6 | Exceptional 98.3% |
| Germans | 100.0 /100 | #7 | Exceptional 98.2% |
| Slovaks | 100.0 /100 | #8 | Exceptional 98.2% |
| Slovenes | 100.0 /100 | #9 | Exceptional 98.2% |
| Swedes | 100.0 /100 | #10 | Exceptional 98.2% |
| English | 100.0 /100 | #11 | Exceptional 98.1% |
| Alaskan Athabascans | 100.0 /100 | #12 | Exceptional 98.1% |
| Tlingit-Haida | 100.0 /100 | #13 | Exceptional 98.1% |
| Carpatho Rusyns | 100.0 /100 | #14 | Exceptional 98.1% |
| Inupiat | 100.0 /100 | #15 | Exceptional 98.1% |